Fig. 3
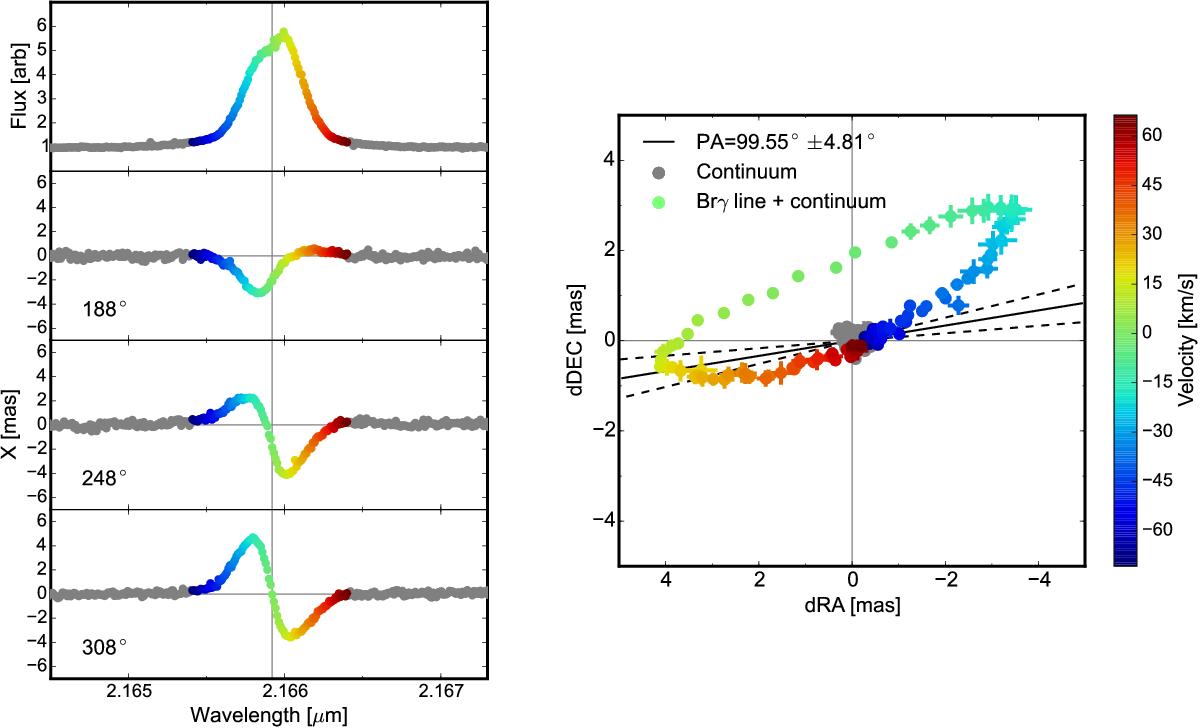
Left: VLT/CRIRES high-resolution (R = 100 000) Brγ spectrum (top panel) and centroid displacements of the Brγ-emitting region (lower panels) for MWC297. The position angle of each slit is shown to the left of each phase panel. Right: derived 2D photocenter displacement vectors of the Brγ + continuum emission for MWC297. The black line shows the position angle of the disk major axis determined from our AMBER LR observations.
Current usage metrics show cumulative count of Article Views (full-text article views including HTML views, PDF and ePub downloads, according to the available data) and Abstracts Views on Vision4Press platform.
Data correspond to usage on the plateform after 2015. The current usage metrics is available 48-96 hours after online publication and is updated daily on week days.
Initial download of the metrics may take a while.