Fig. 10
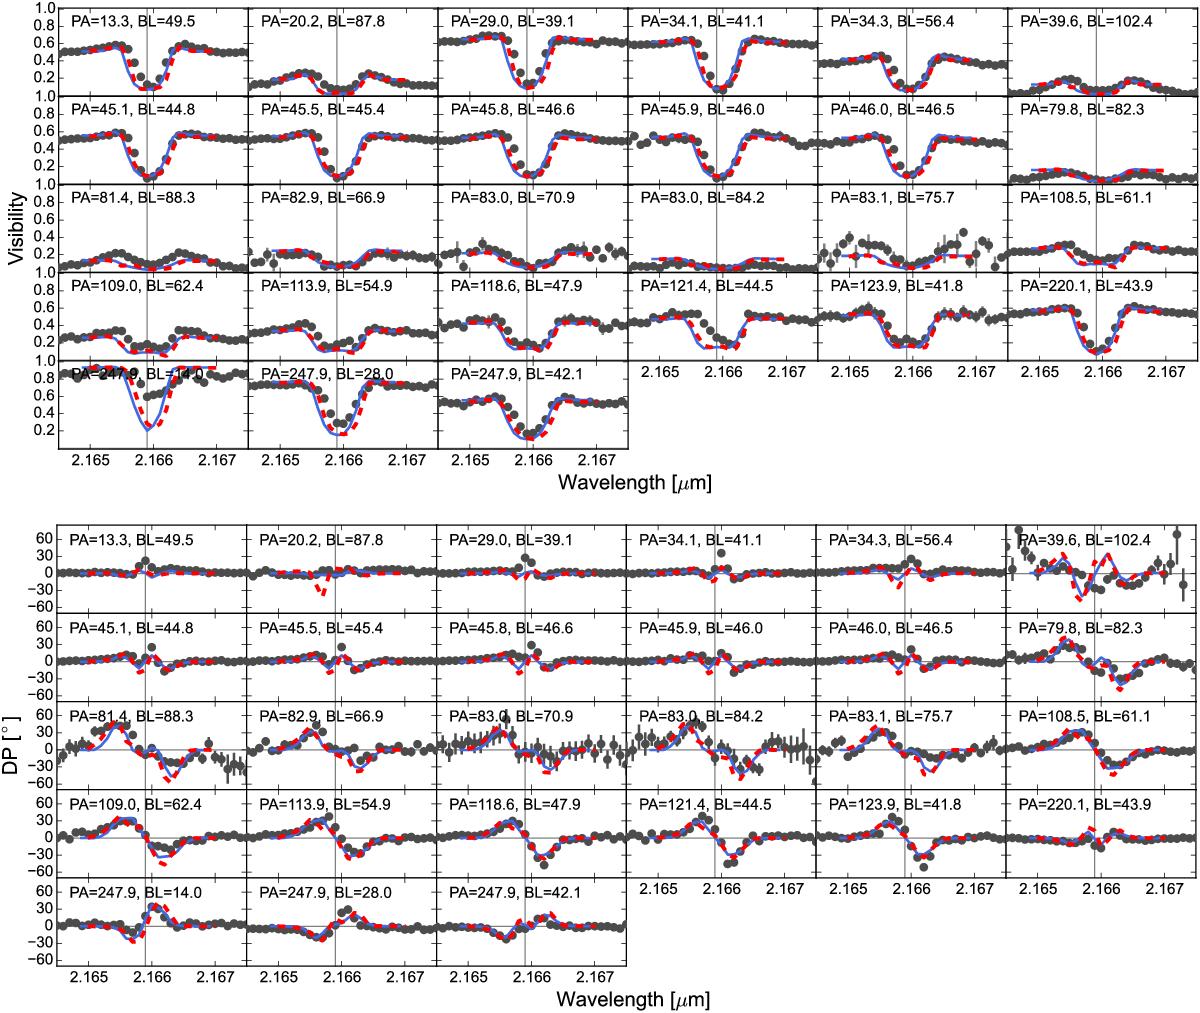
Visibilities (upper panel) and differential phases (lower panel) calculated from our kinematic models and compared to our observed data. The solid blue line represents the simple Keplerian disk model and the dashed red line represents our simple disk wind model. Data points are gray. The frame with PA = 39.6, BL = 102.4 is offset by 180° in order to see the differential phase changes at the Brγ line center.
Current usage metrics show cumulative count of Article Views (full-text article views including HTML views, PDF and ePub downloads, according to the available data) and Abstracts Views on Vision4Press platform.
Data correspond to usage on the plateform after 2015. The current usage metrics is available 48-96 hours after online publication and is updated daily on week days.
Initial download of the metrics may take a while.