Fig. 1
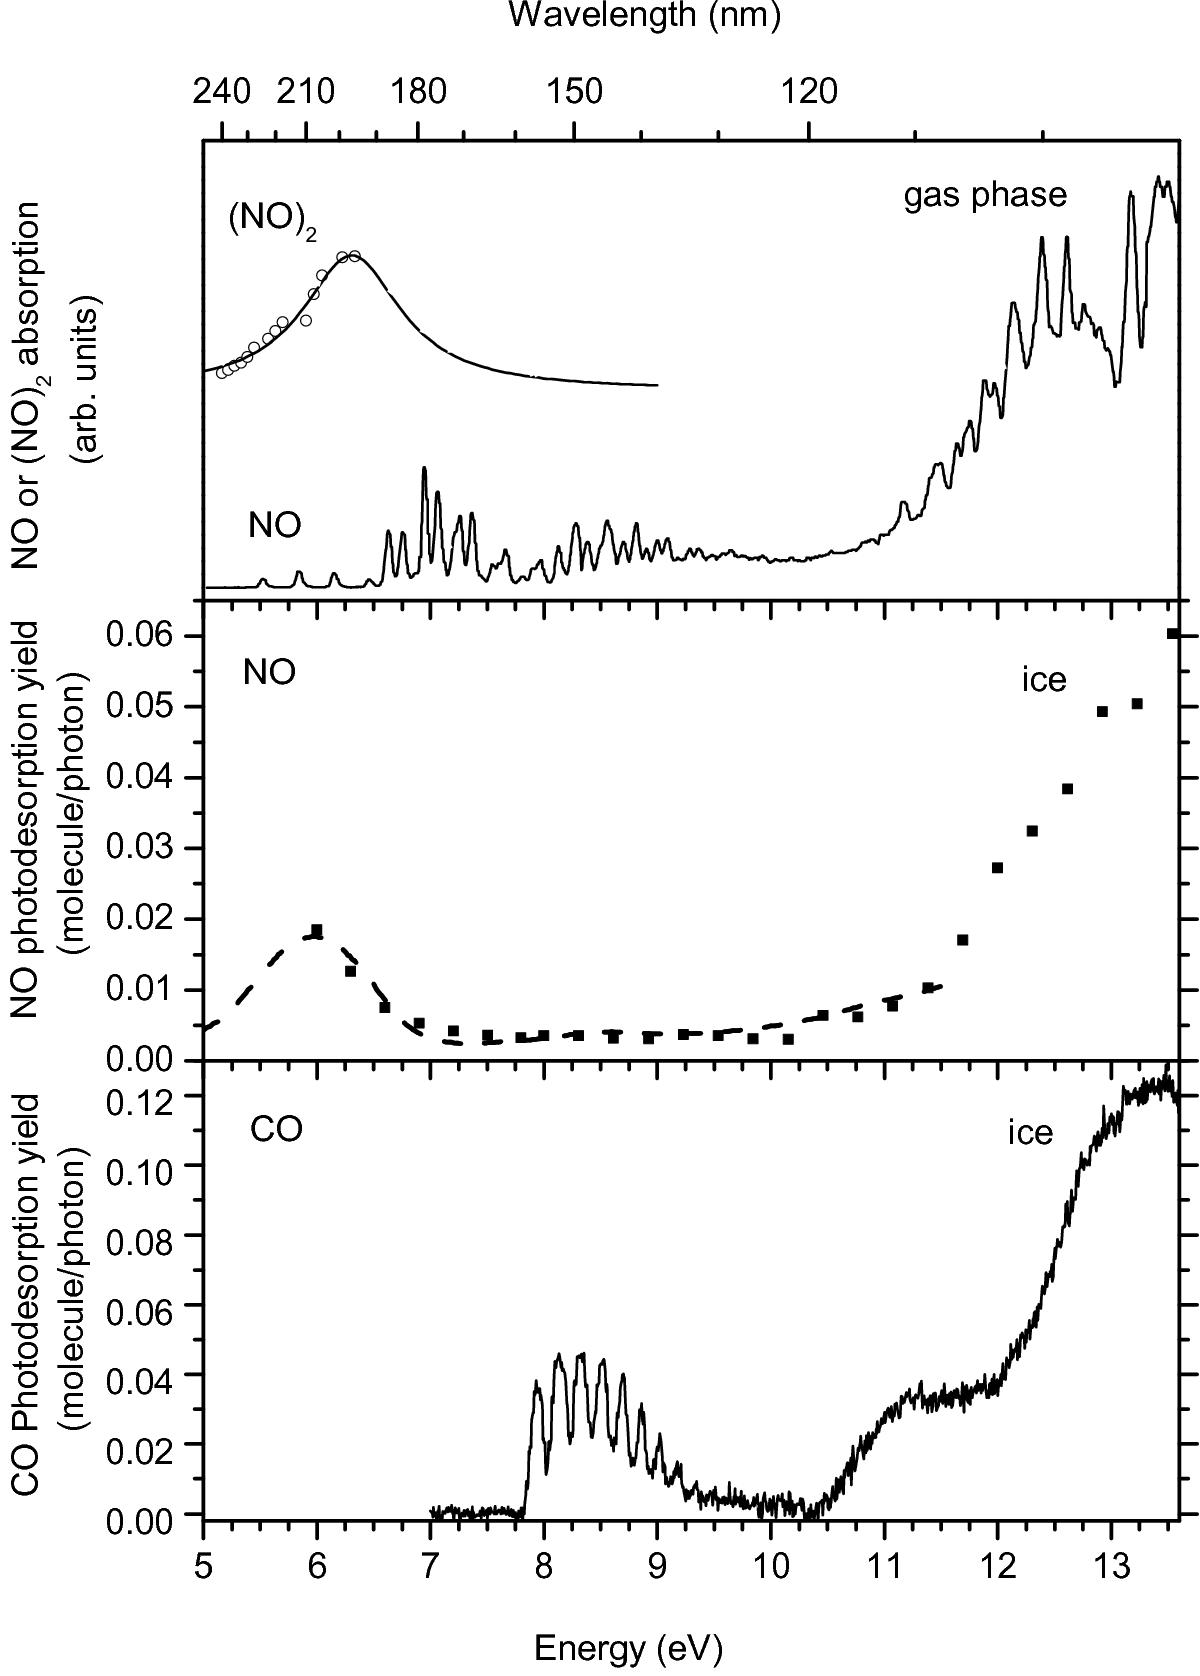
Upper panel: electronic spectrum of gas-phase NO from Chang et al. (1993) and electronic spectrum of gas-phase (NO)2 from Forte & Van Den Bergh (1978, open dots) and its Lorentzian fit (solid line). Middle panel: NO photodesorption spectrum of 10 ML thick NO ice on HOPG at 10 K between 6 and 13.6 eV (filled squares). Large energy steps of 0.3 eV were used to avoid ice ageing. Absorption spectrum of pure solid NO from Lu et al. (2008) between 5 and 11.7 eV (dashed line). The absorption spectrum is scaled to the photodesorption spectrum. Lower panel: CO photodesorption spectrum of a 20 ML thick CO ice on gold at 10 K between 7 and 13.6 eV (Dupuy et al. 2017).
Current usage metrics show cumulative count of Article Views (full-text article views including HTML views, PDF and ePub downloads, according to the available data) and Abstracts Views on Vision4Press platform.
Data correspond to usage on the plateform after 2015. The current usage metrics is available 48-96 hours after online publication and is updated daily on week days.
Initial download of the metrics may take a while.