Fig. 10
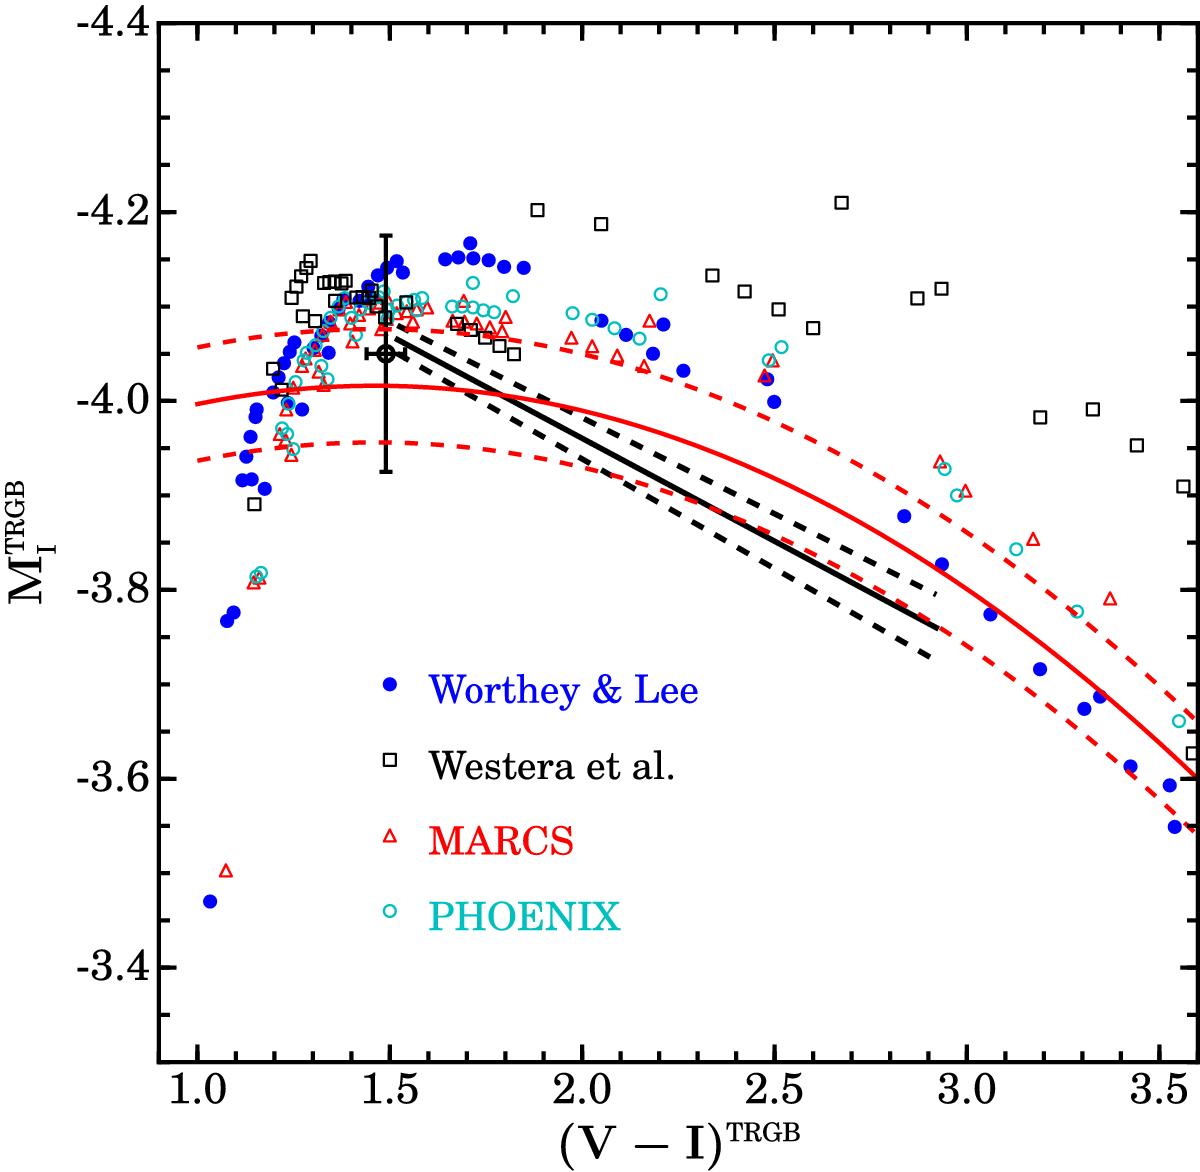
As Fig. 8, but including the empirical value obtained for the Galactic globular cluster ω Cen (open circle with error bars), and the empirical relationships by Rizzi et al. (2007) and Jang & Lee (2017b) based on samples of local galaxies (black and red lines, respectively; see text for details). The solid lines denote mean values of the relationships, while the dashed lines denote, respectively, the brighter and lower limits according to the 1σ uncertainty on the slope and zero point of Rizzi et al. (2007) results, and the 1σ uncertainty on the zero point of Jang & Lee (2017b) calibration.
Current usage metrics show cumulative count of Article Views (full-text article views including HTML views, PDF and ePub downloads, according to the available data) and Abstracts Views on Vision4Press platform.
Data correspond to usage on the plateform after 2015. The current usage metrics is available 48-96 hours after online publication and is updated daily on week days.
Initial download of the metrics may take a while.