Fig. 7
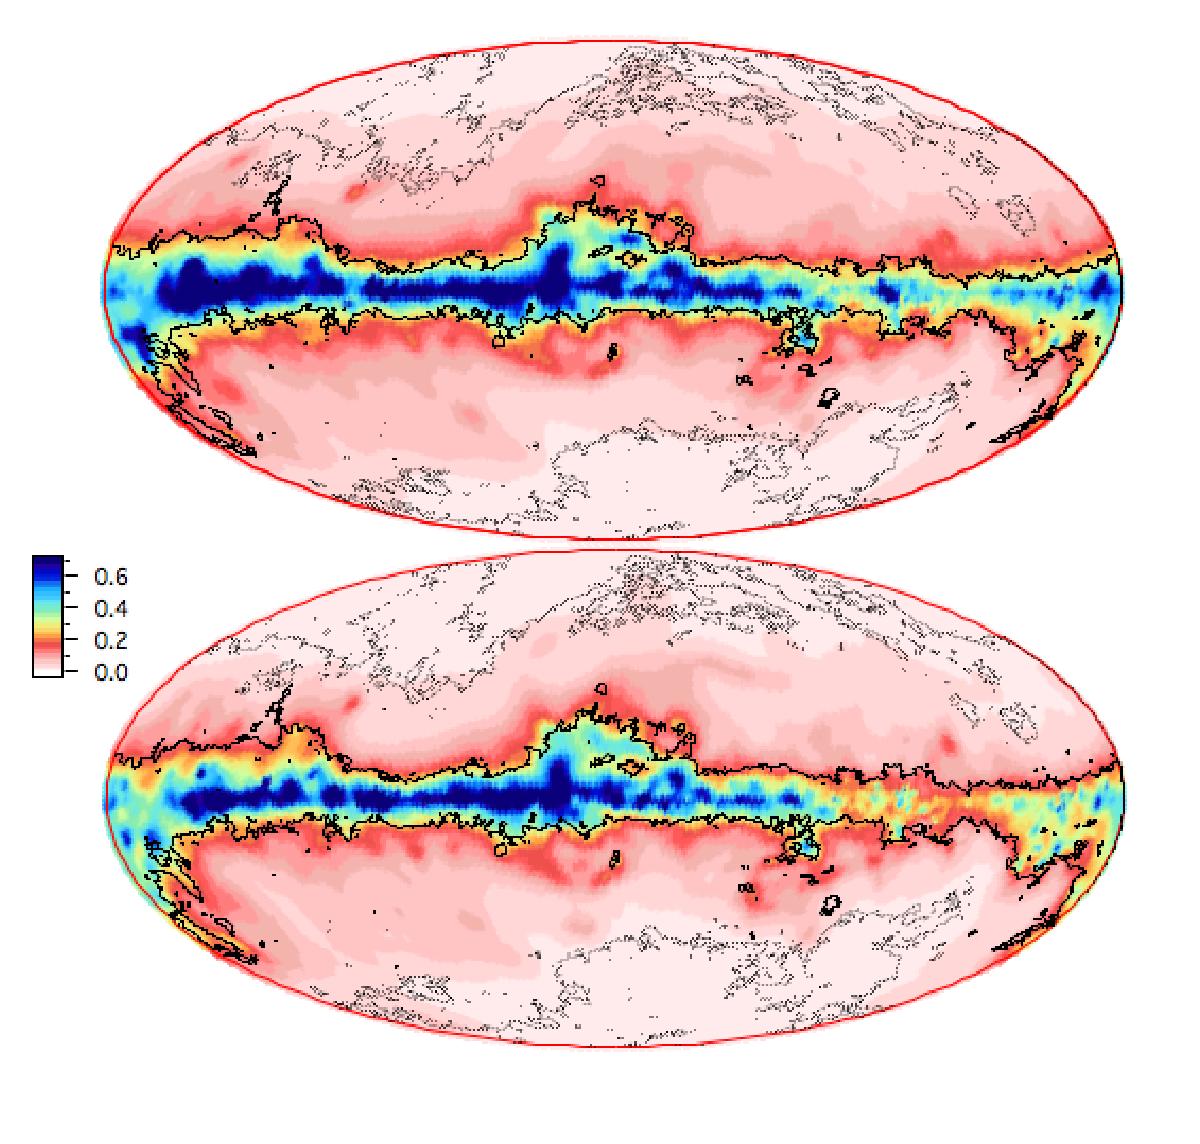
Full-sky 2D map of opacity distribution integrated from the Sun to the boundaries of our computational domain (abs(Z) = 300 pc, abs(X) = 2 kpc, abs(Y) = 2 kpc). Top: LVV results are shown (distribution A). Bottom: the final inversion with APOGEE data and the Pan-STARRS based prior distribution are shown (distribution D). Isocontours from Schlegel et al. (1998) for E(B − V) = 0.025 and E(B − V) = 0.32 are superimposed as dotted and continuous black lines. The map is in Aitoff Galactic coordinates. Longitudes decrease from +180° to −180° from left to right. The color scale refers to E(B − V), linear, in units of mag.
Current usage metrics show cumulative count of Article Views (full-text article views including HTML views, PDF and ePub downloads, according to the available data) and Abstracts Views on Vision4Press platform.
Data correspond to usage on the plateform after 2015. The current usage metrics is available 48-96 hours after online publication and is updated daily on week days.
Initial download of the metrics may take a while.