Fig. 6
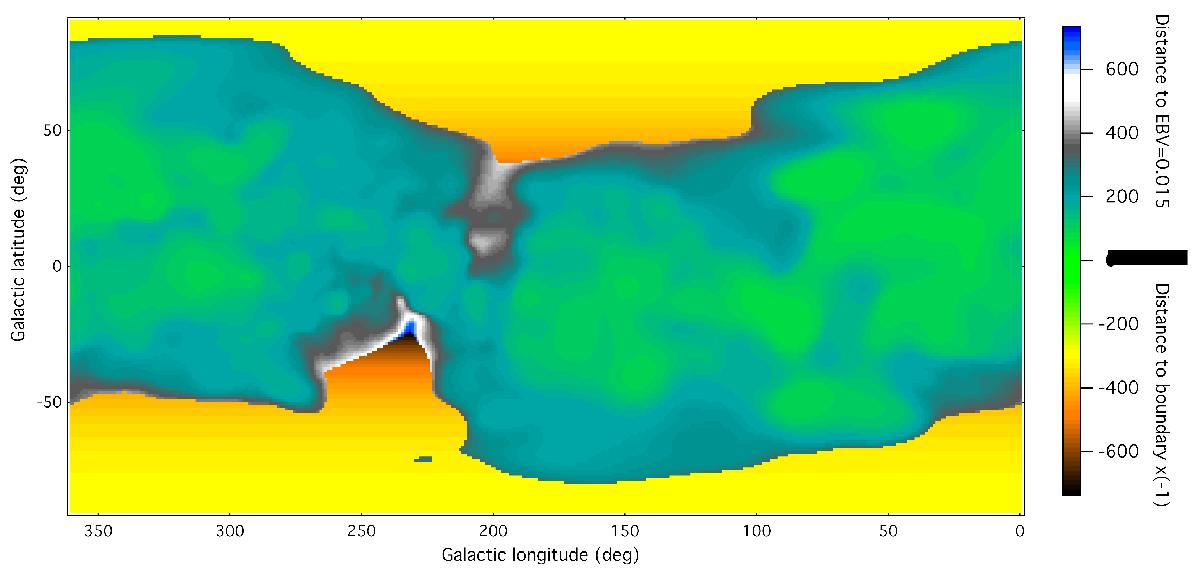
Local cavity boundaries: the distance at which a color excess of 0.015 mag is reached is plotted as a function of rectangular Galactic coordinates. In very weakly reddened directions for which 0.015 mag is not reached within our computation domain, the distance to the domain boundary is plotted after conversion to negative values. This allows us to distinguish between the two cases well. The figure illustrates well the local warp of gas associated with the Gould belt, i.e., more matter at positive latitudes in the Galactic center hemisphere and at negative latitudes in the anticenter hemisphere. It also reveals very clearly the local bubble openings to the halo at about 210−240![]() longitude.
longitude.
Current usage metrics show cumulative count of Article Views (full-text article views including HTML views, PDF and ePub downloads, according to the available data) and Abstracts Views on Vision4Press platform.
Data correspond to usage on the plateform after 2015. The current usage metrics is available 48-96 hours after online publication and is updated daily on week days.
Initial download of the metrics may take a while.