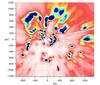
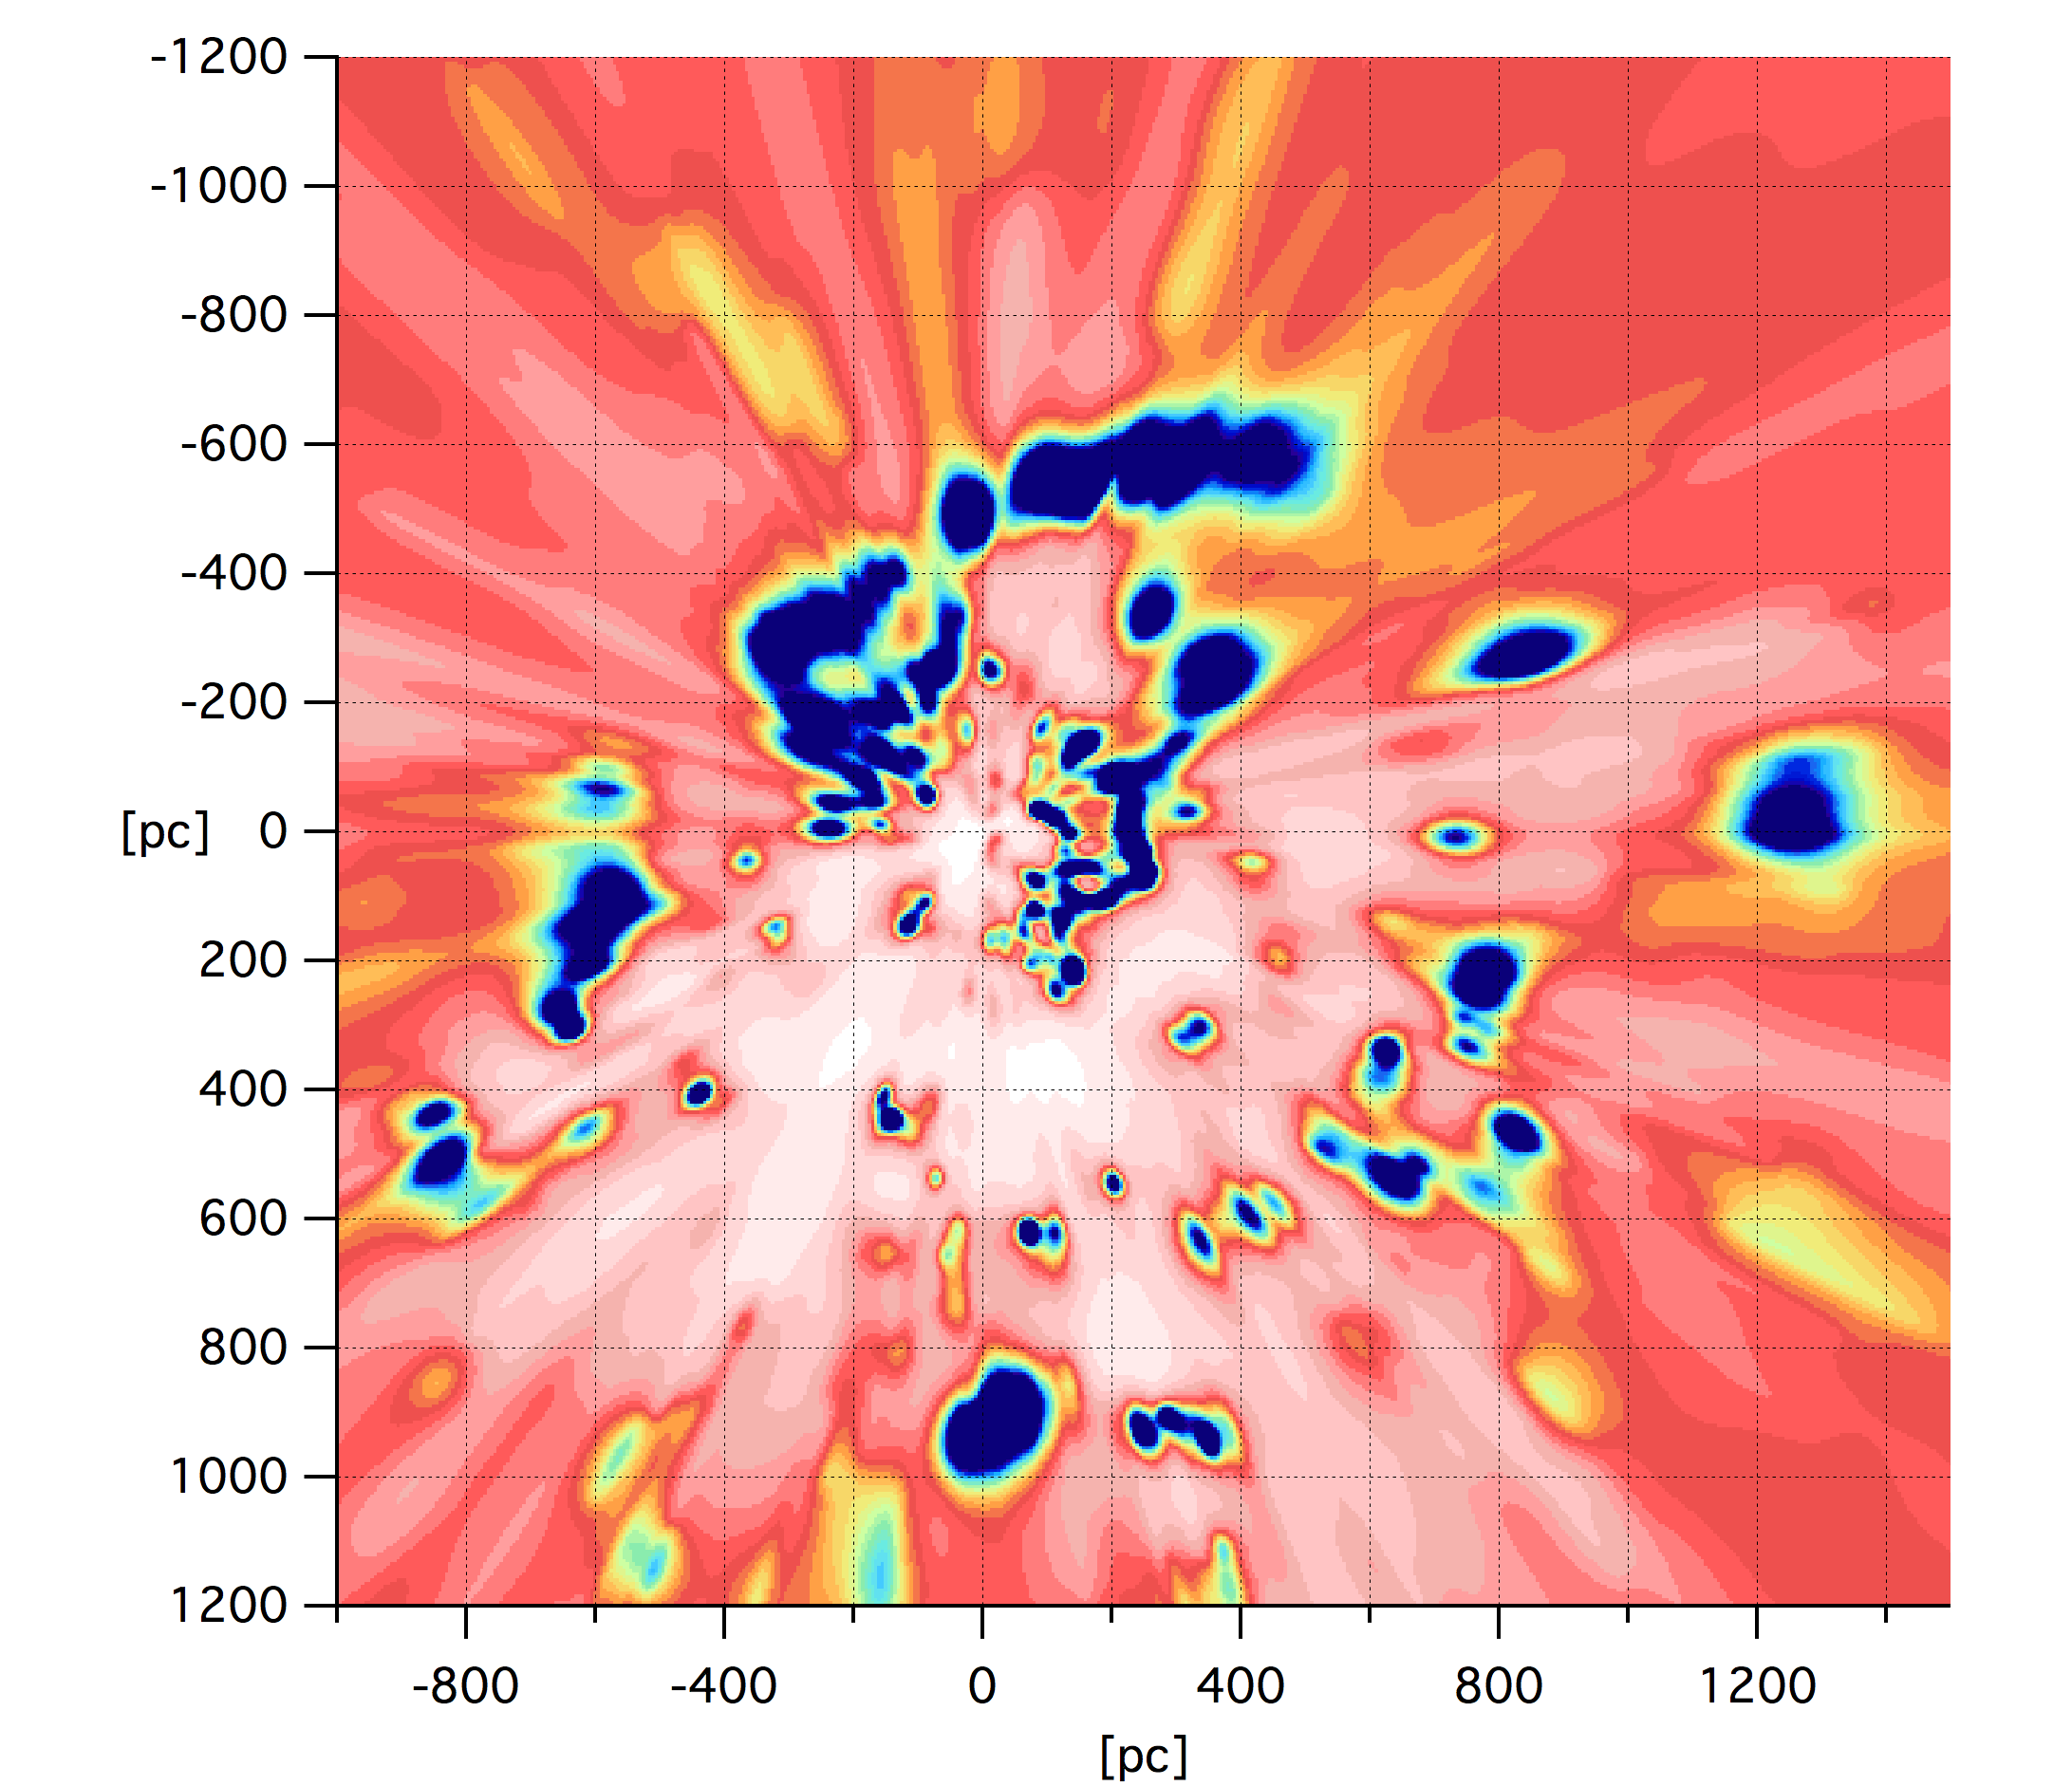
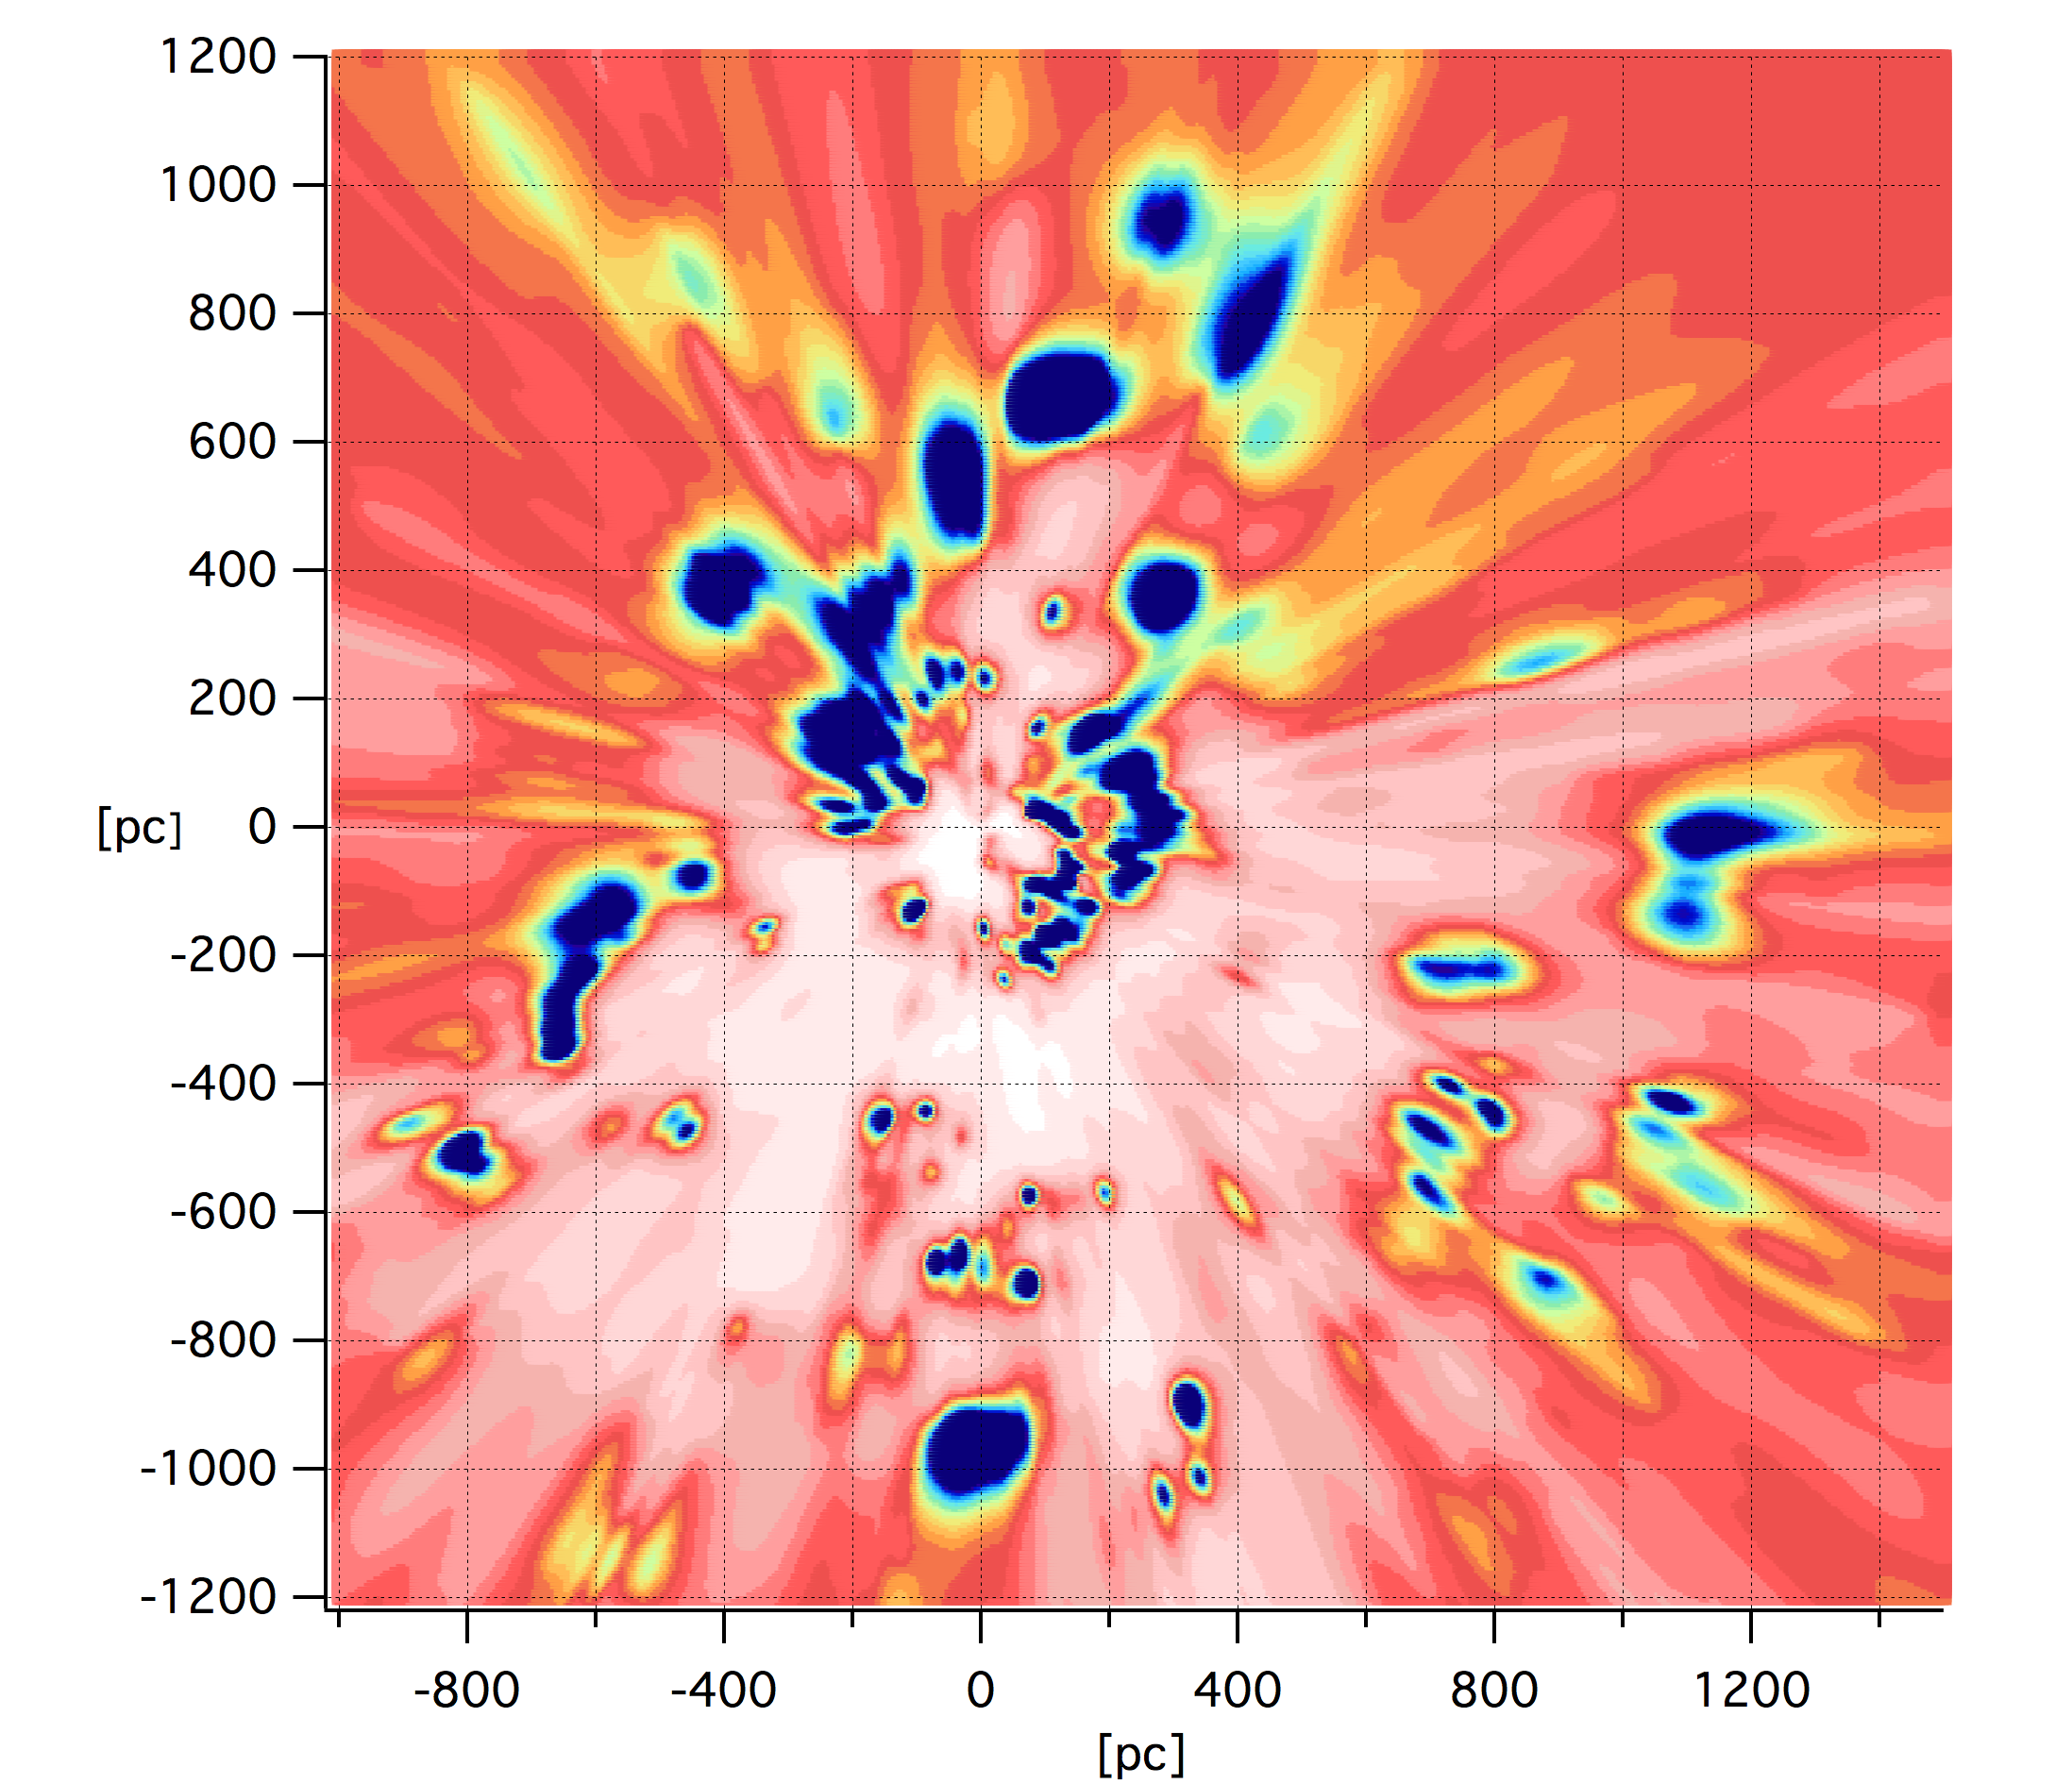
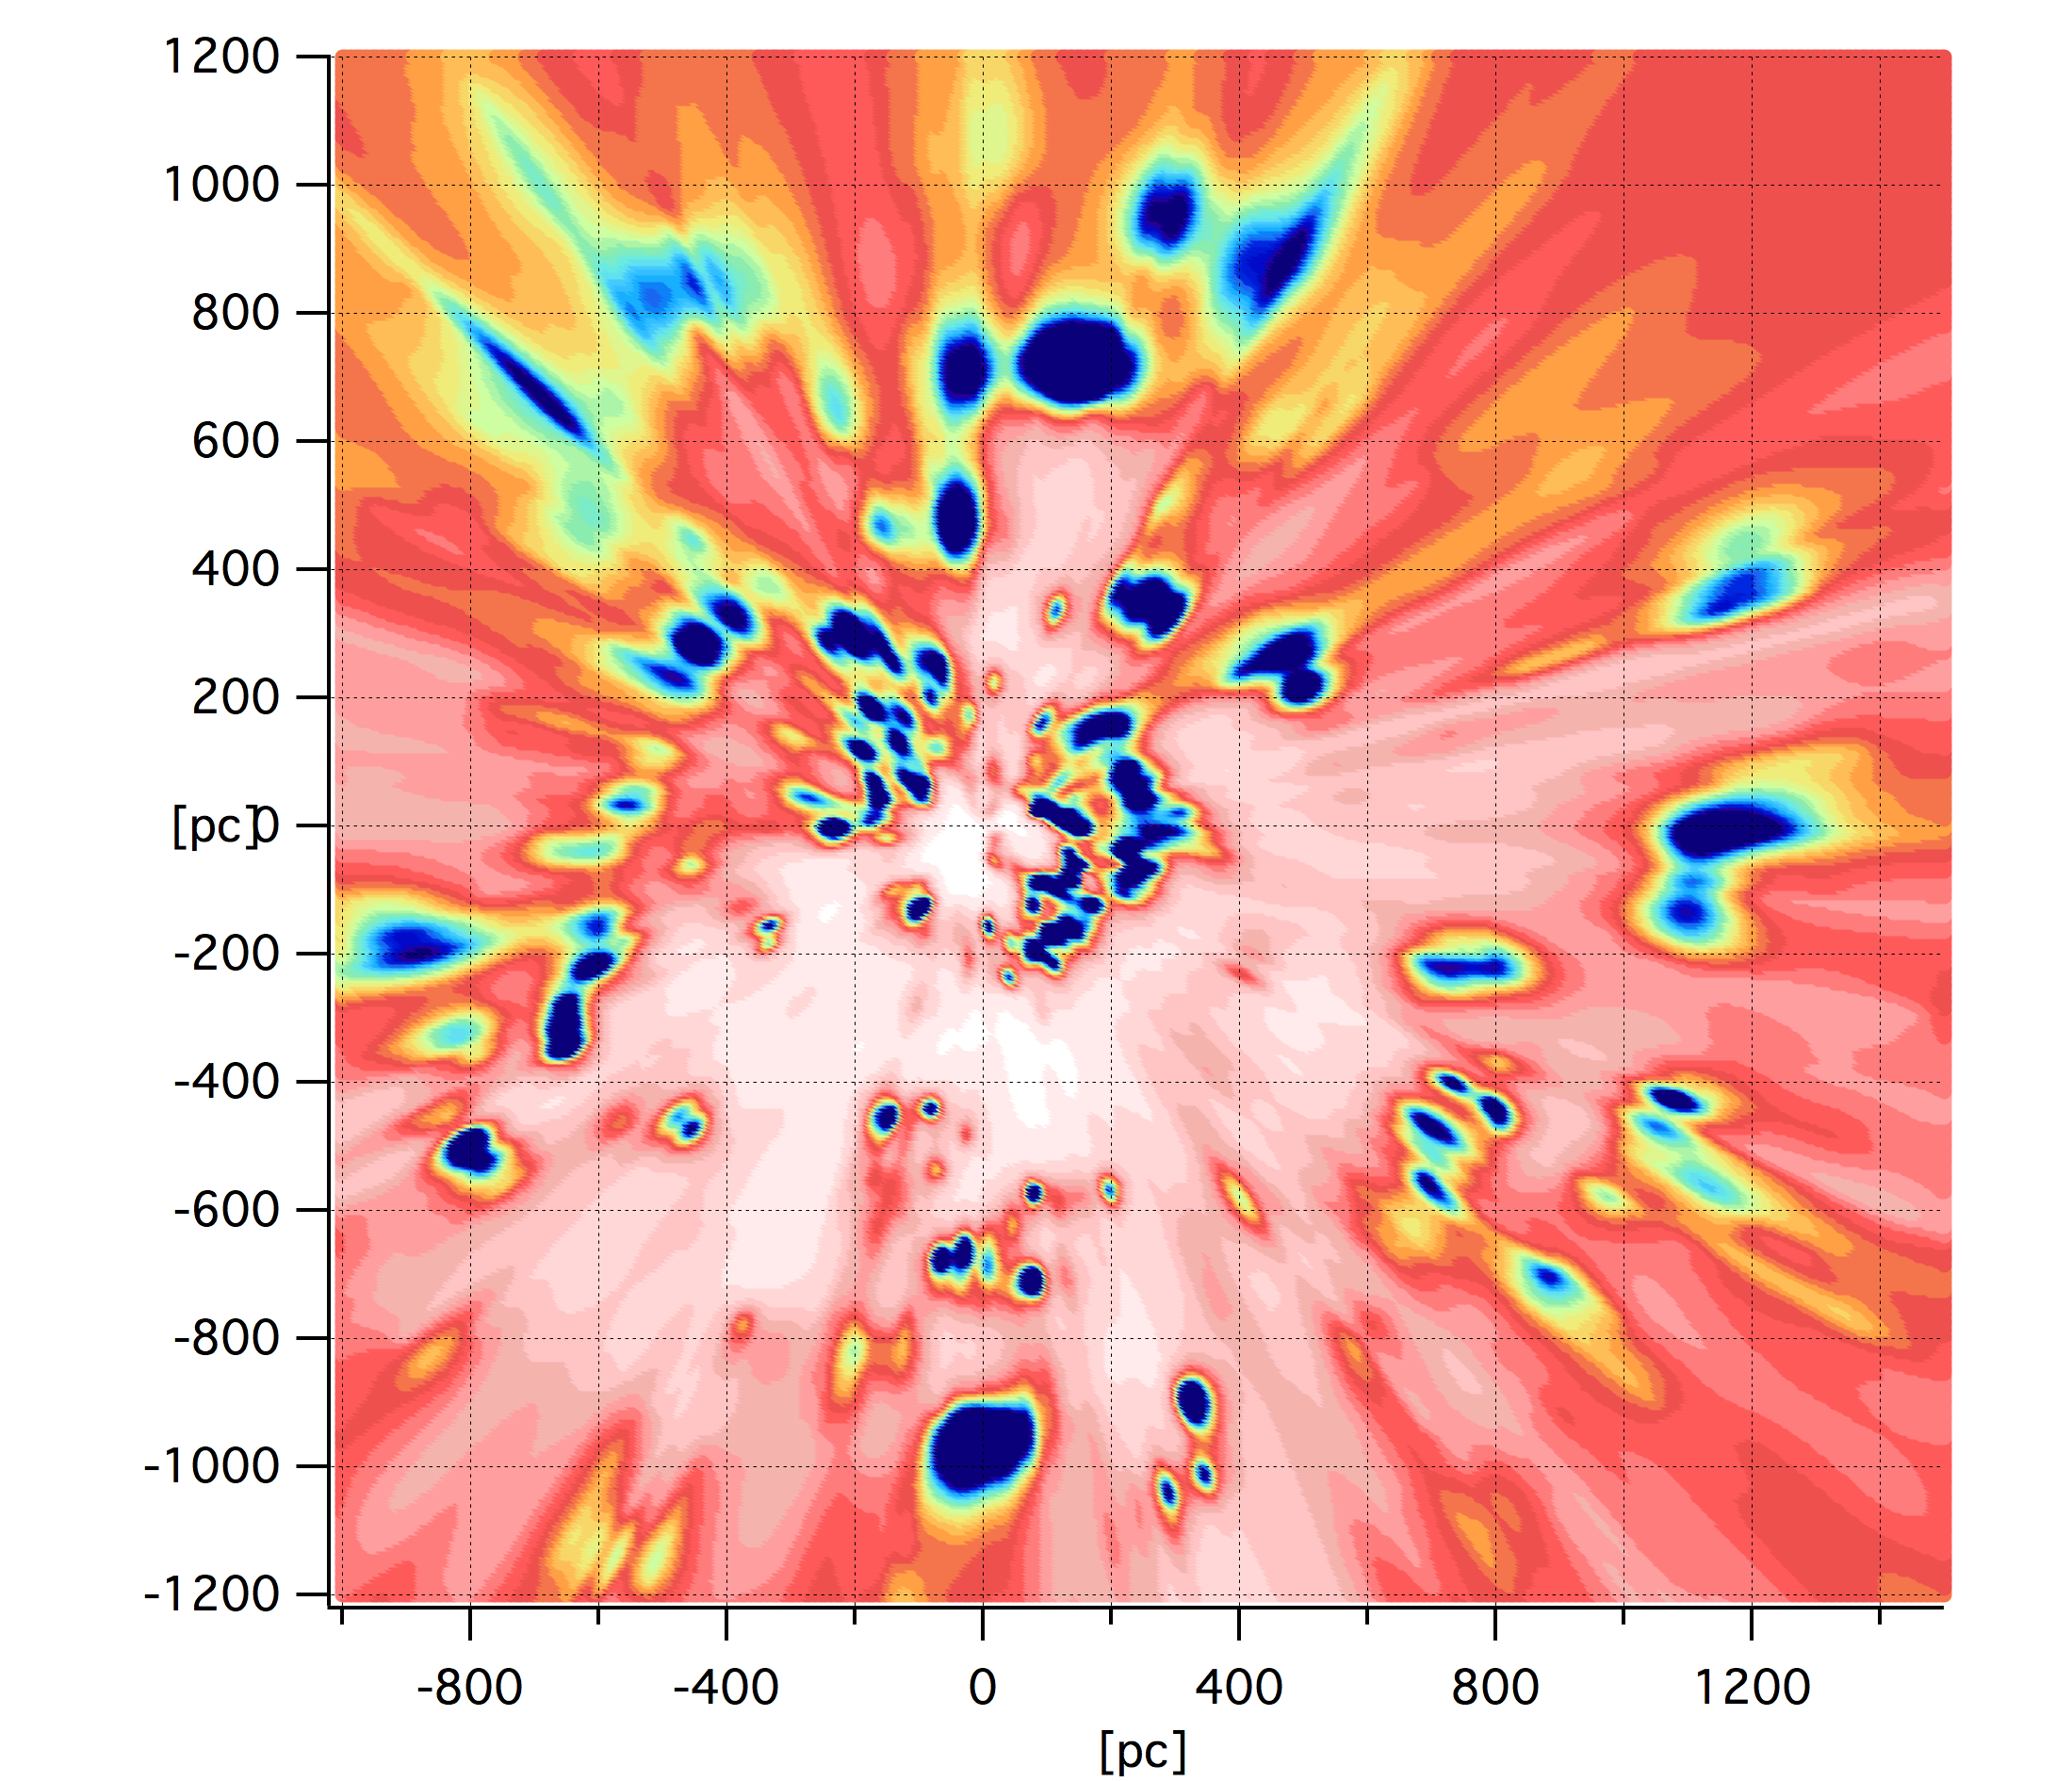
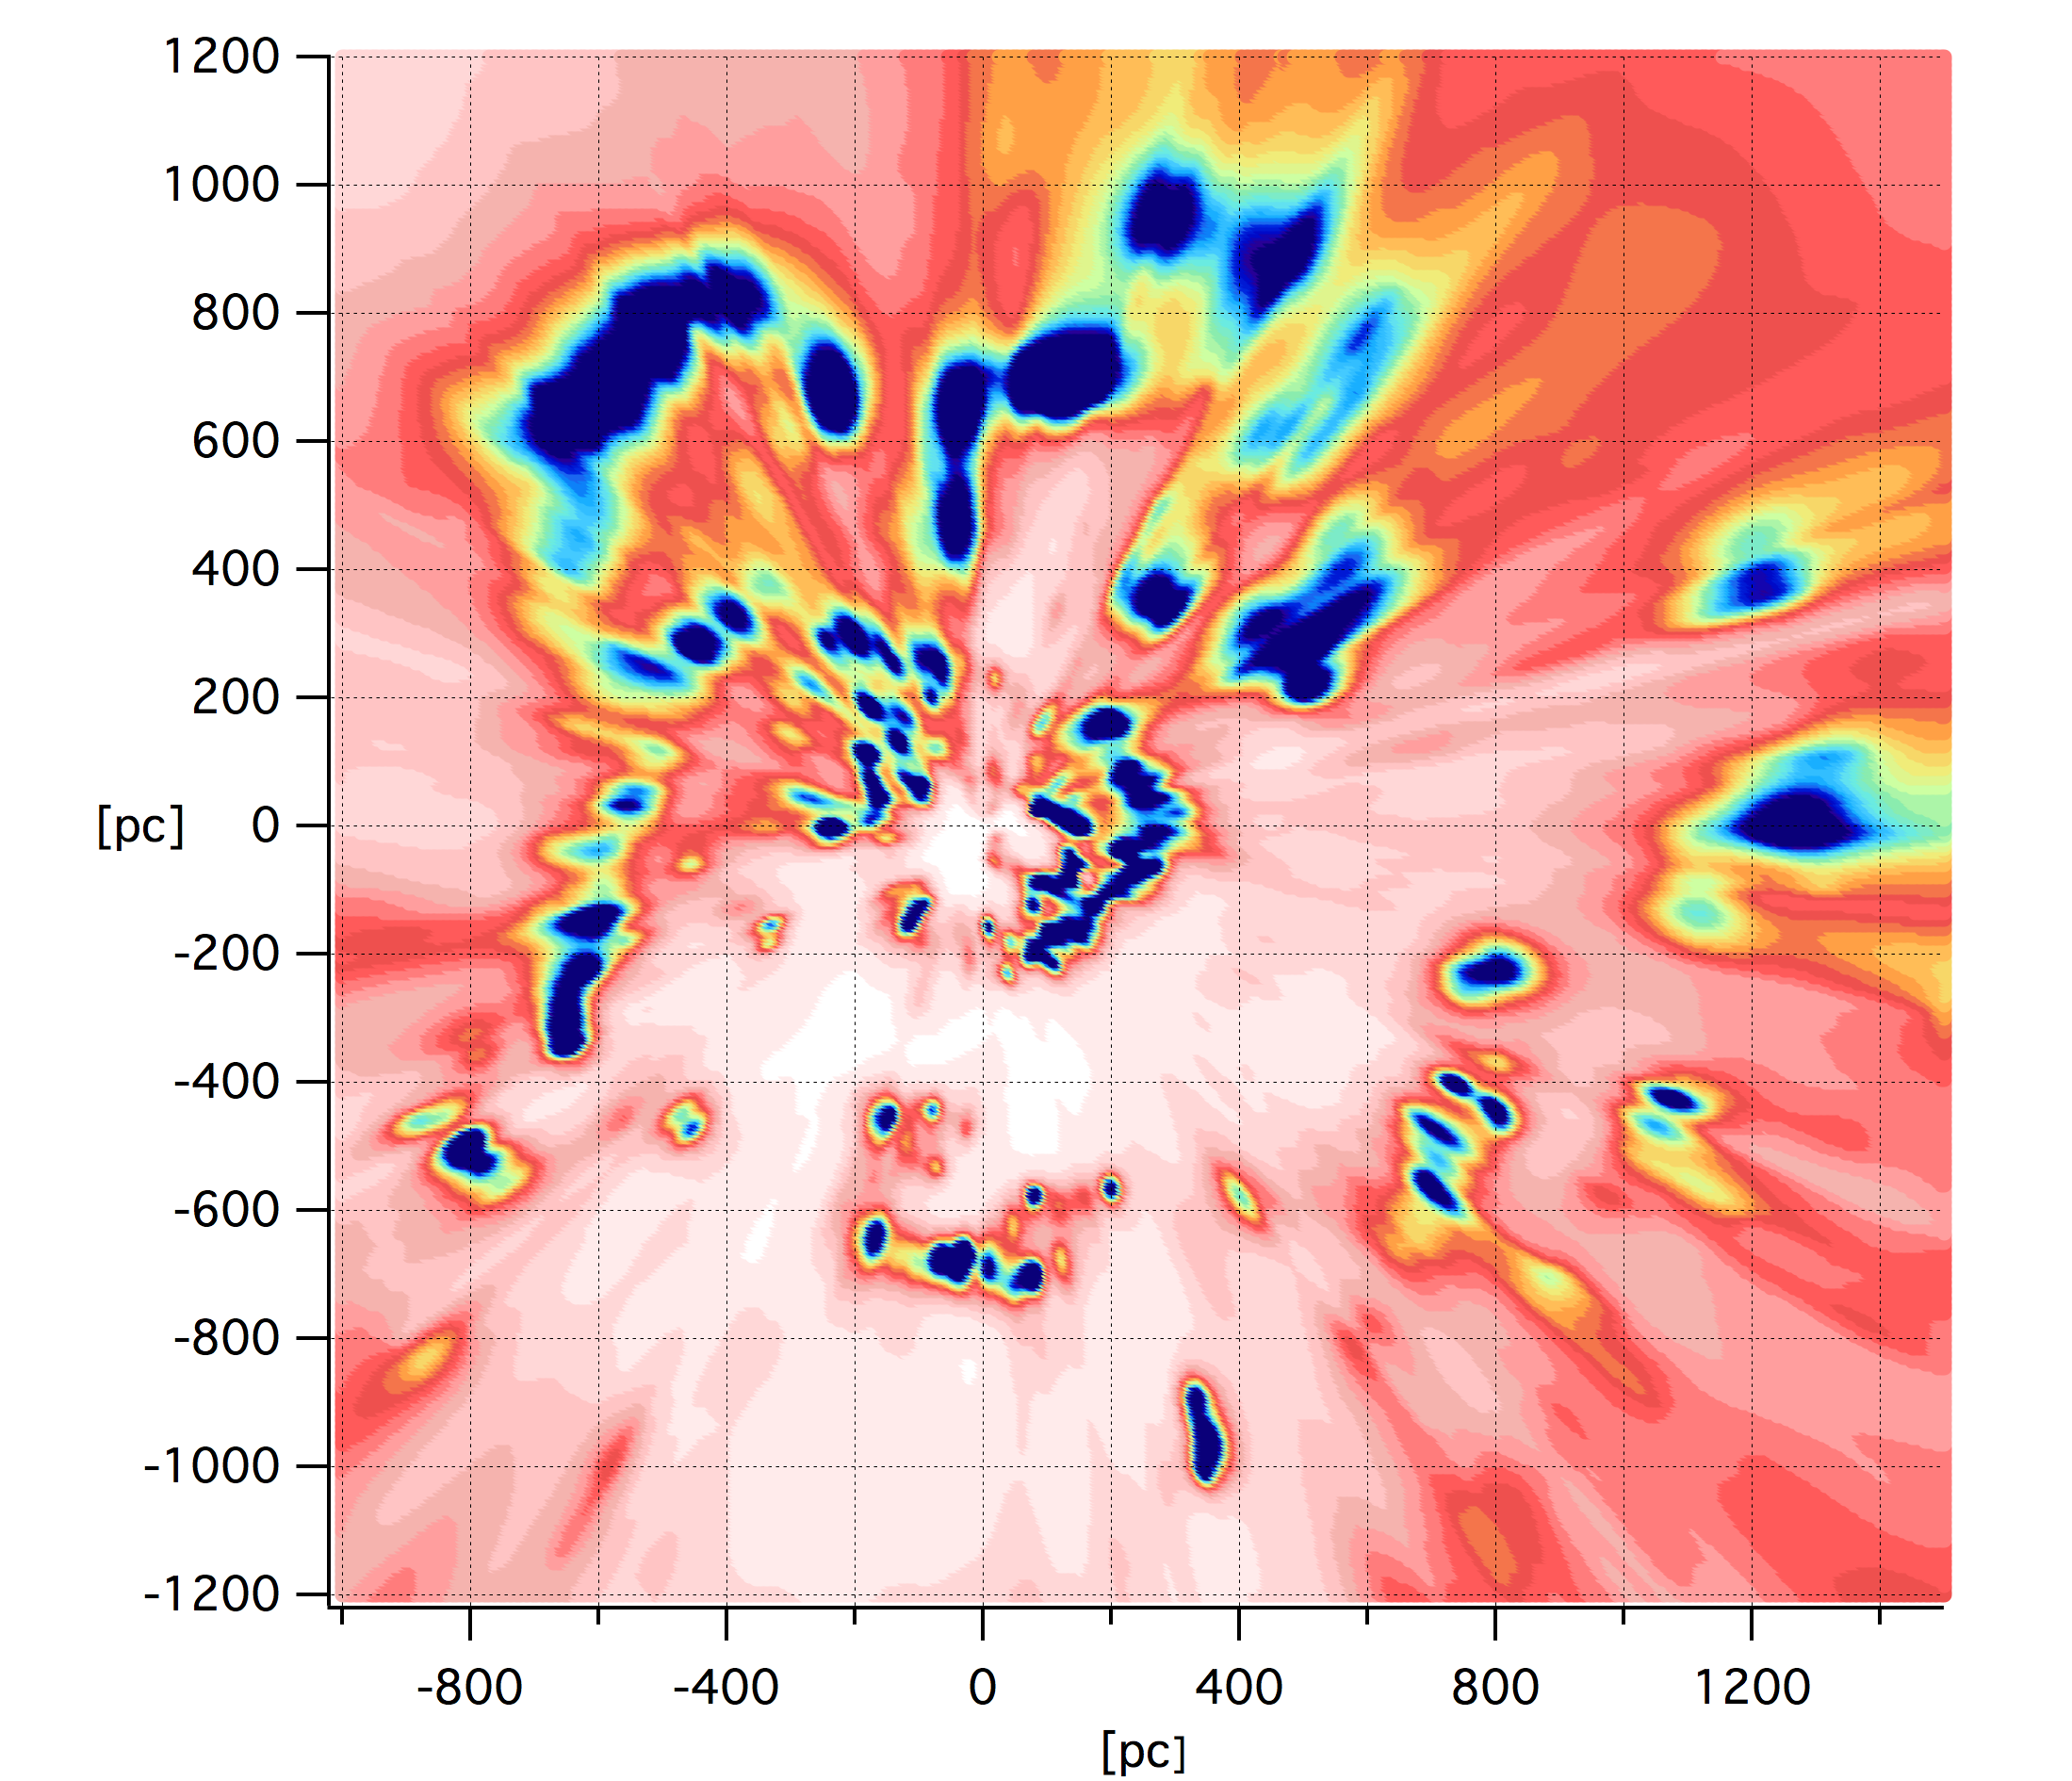
Fig. 4
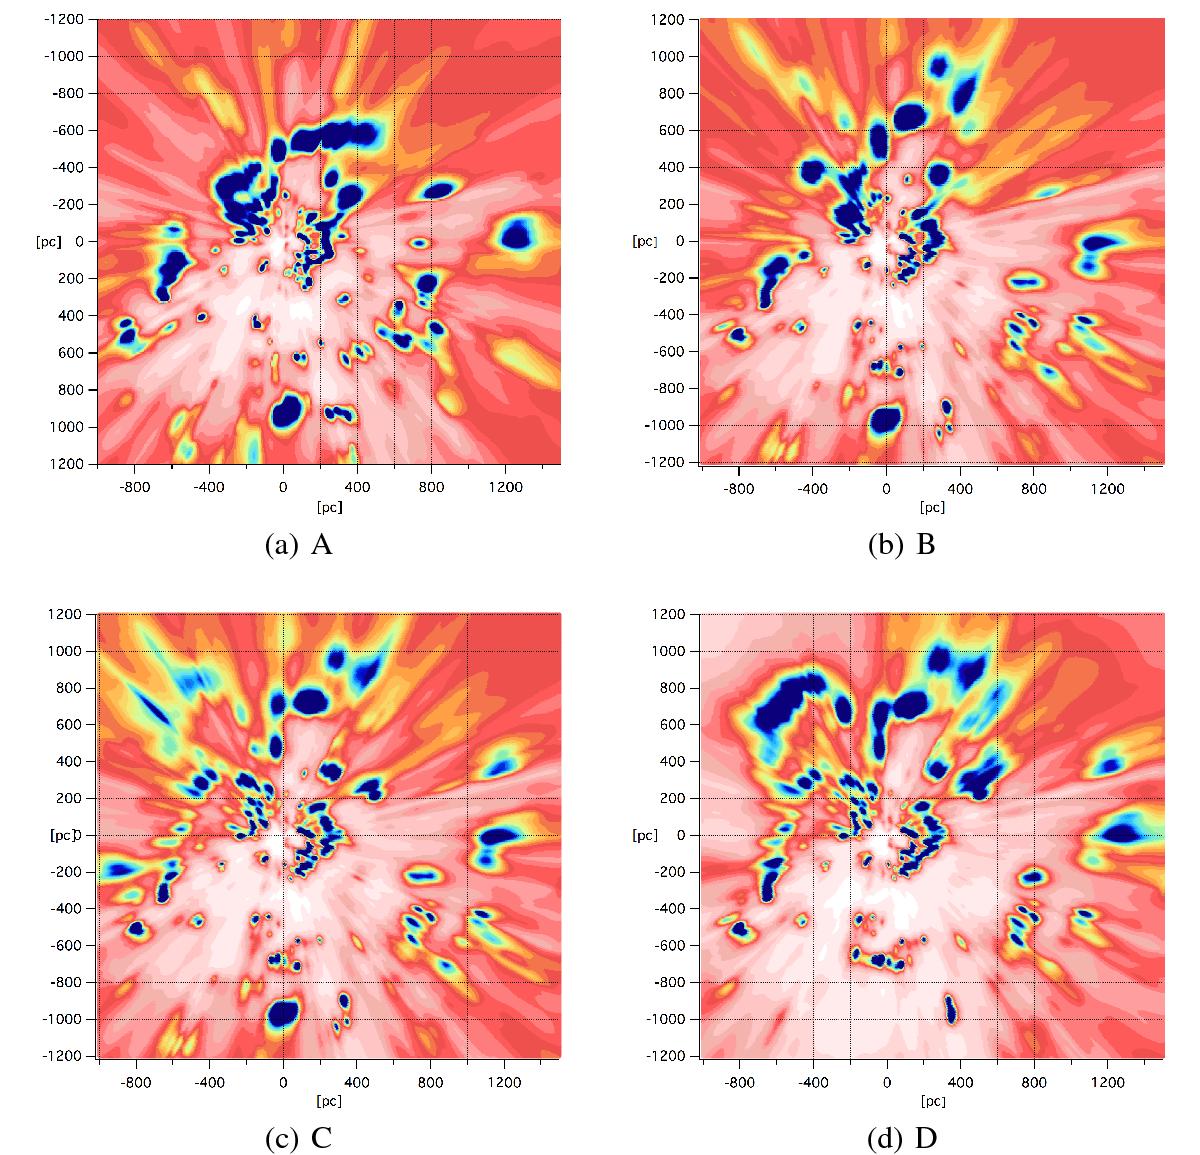
Galactic plane cut in the 3D opacity distribution resulting from the four successive inversions: panel a: A distribution: color excess data alone and Hipparcos or photometric distances. Panel b: B distribution: same as A except for the replacement of 80% of the initial distances with Gaia-DR1 (TGAS) values. For the 20% of stars without Gaia distance we kept the previous value. Panel c: C distribution: same as B except for the addition of DIB-based color excess estimates for stars with a Gaia-DR1 parallax. Panel d: D distribution: same as C except for the use of a Pan-STARRS based prior distribution instead of a homogeneous distribution. Color scale, direction of Galactic center, and Sun position are the same as in Fig. 3.
Current usage metrics show cumulative count of Article Views (full-text article views including HTML views, PDF and ePub downloads, according to the available data) and Abstracts Views on Vision4Press platform.
Data correspond to usage on the plateform after 2015. The current usage metrics is available 48-96 hours after online publication and is updated daily on week days.
Initial download of the metrics may take a while.