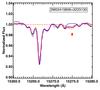
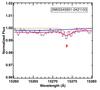
Fig. 2
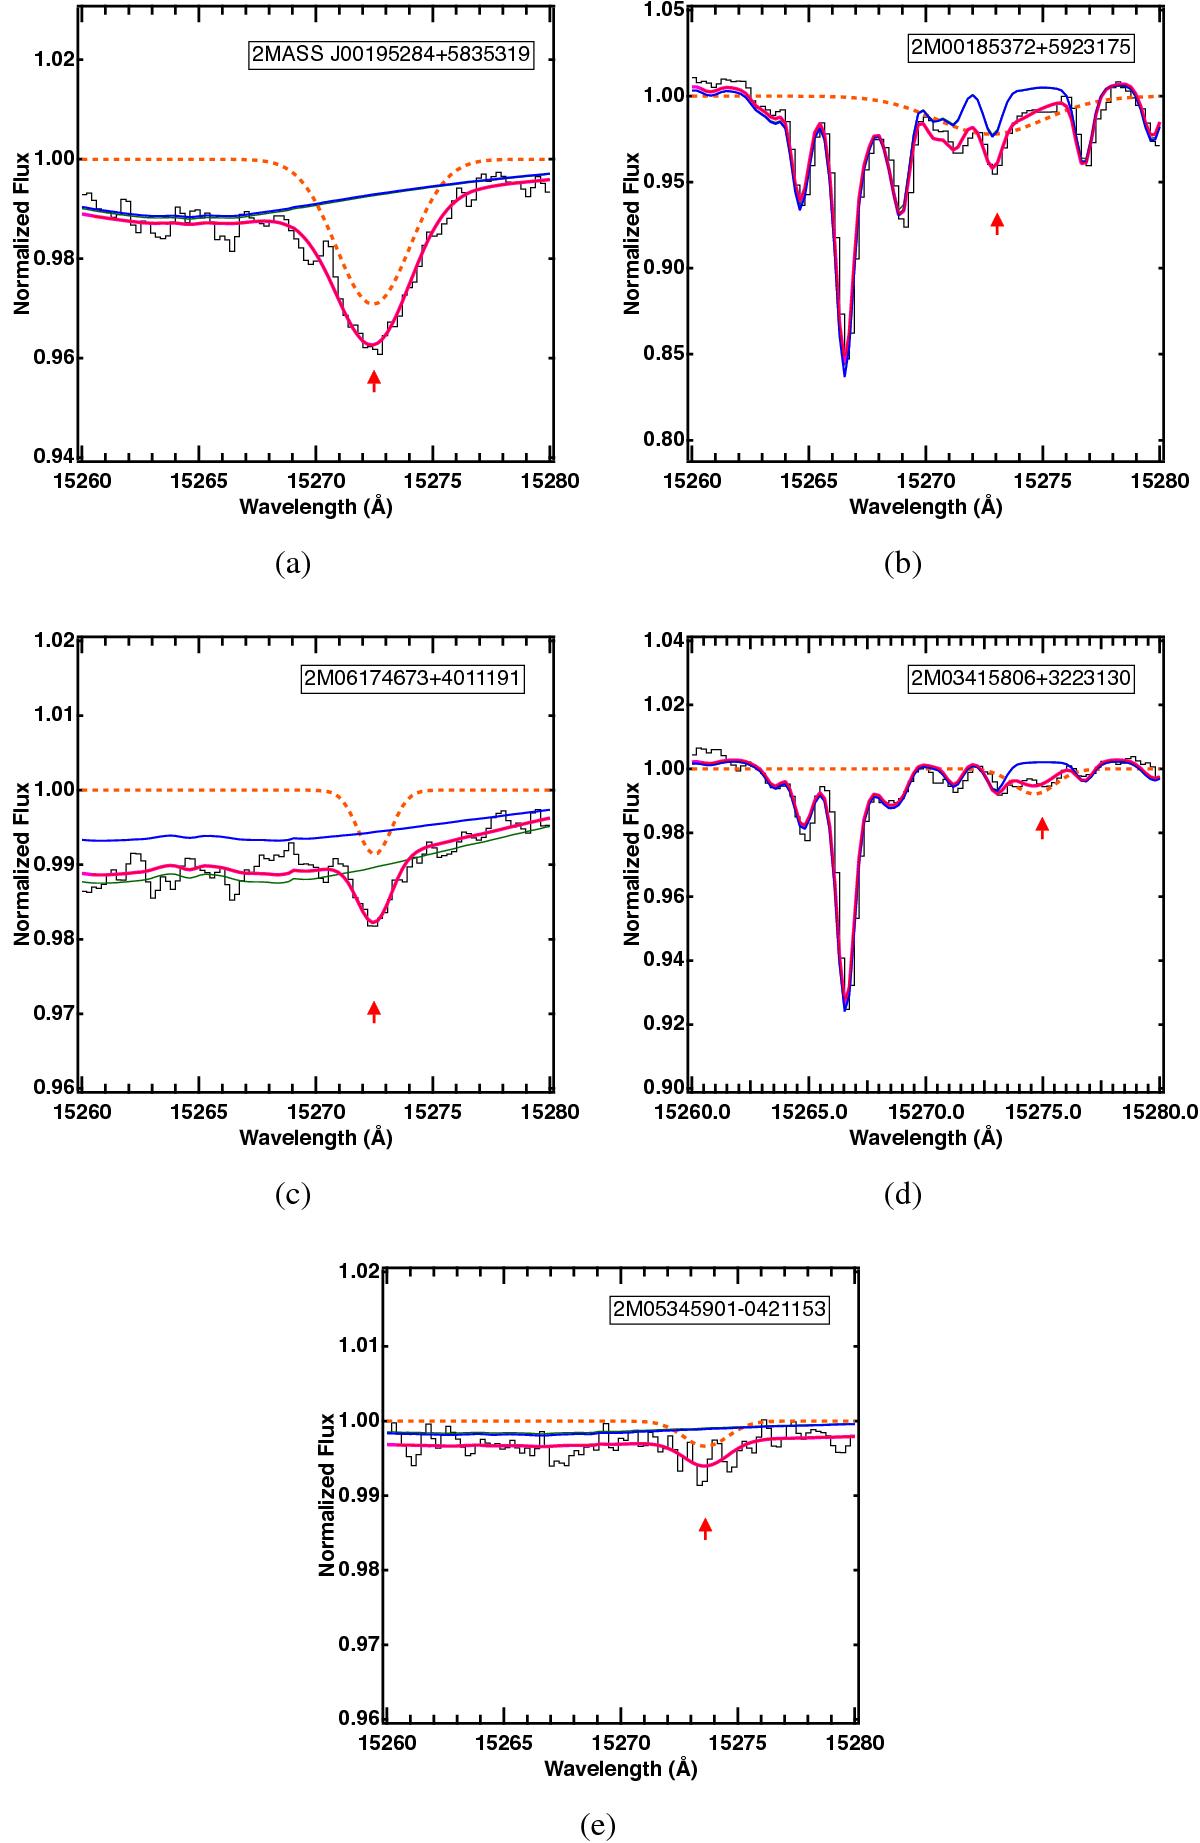
Illustration of the various categories of DIB extraction: a) detected; b) recovered; c) narrow; d) recovered and narrow; e) upper limit. APOGEE spectra are shown with solid black curves. The initial stellar model provided by APOGEE and the model obtained after application of the scaling factor are shown in solid blue and green respectively (note that in many cases they are very similar). The DIB absorption alone is represented in orange. The solid magenta curves represent the final stellar+DIB modeled spectrum.
Current usage metrics show cumulative count of Article Views (full-text article views including HTML views, PDF and ePub downloads, according to the available data) and Abstracts Views on Vision4Press platform.
Data correspond to usage on the plateform after 2015. The current usage metrics is available 48-96 hours after online publication and is updated daily on week days.
Initial download of the metrics may take a while.