Free Access
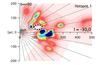
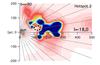
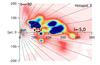
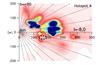
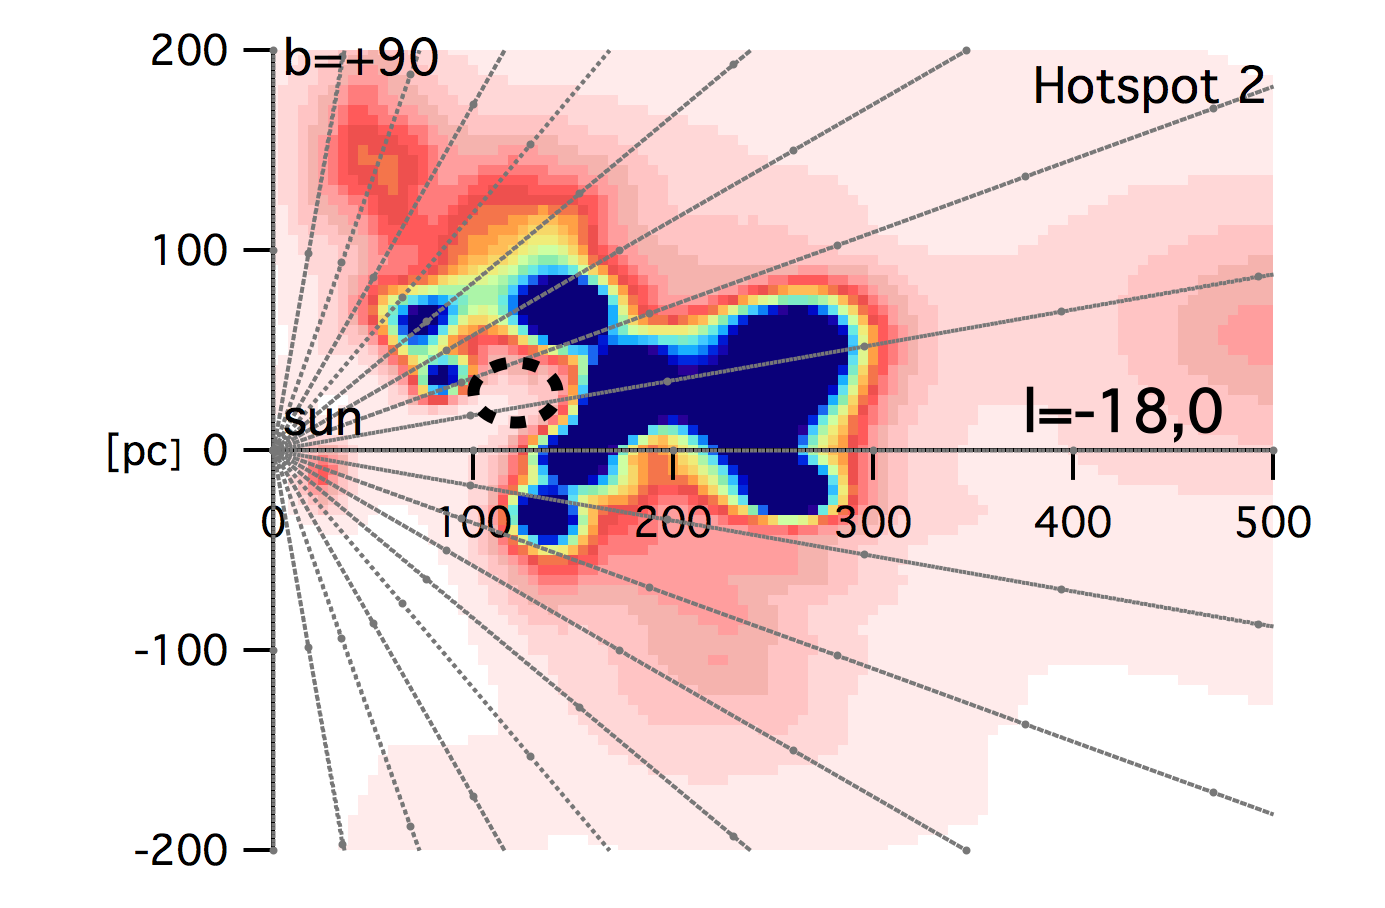
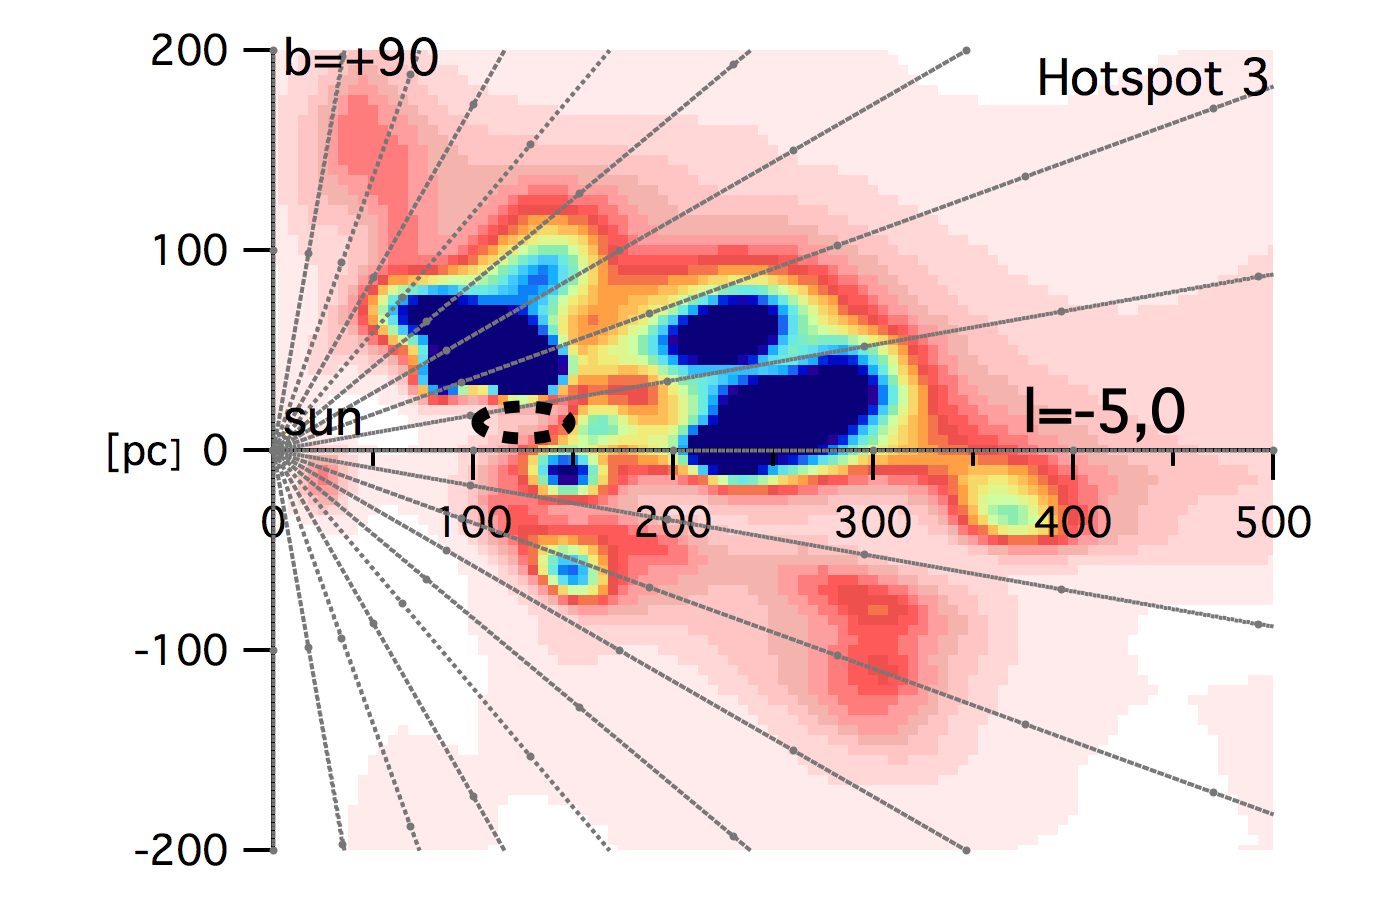
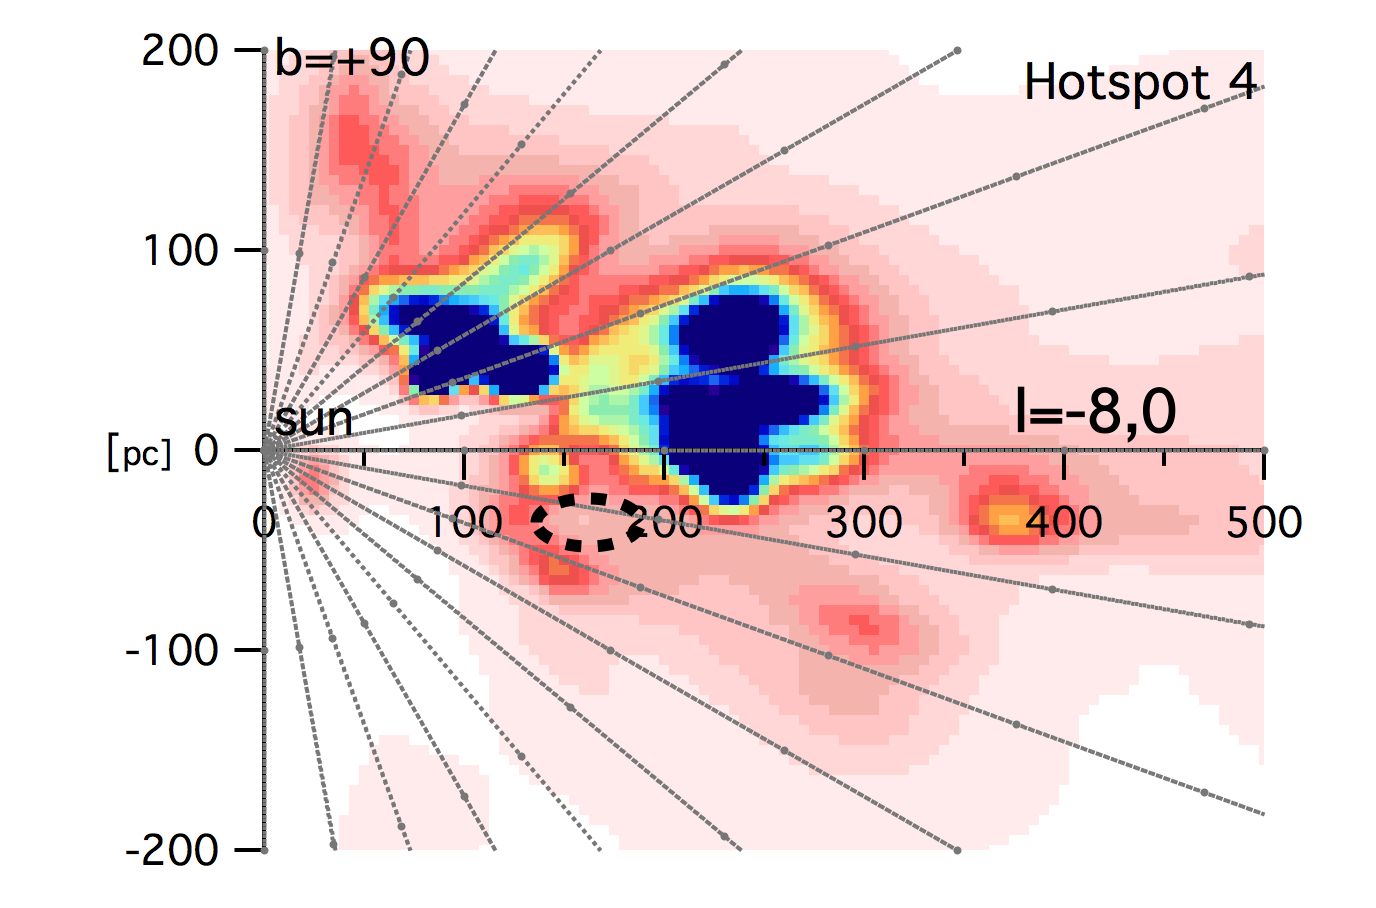
Fig. 15
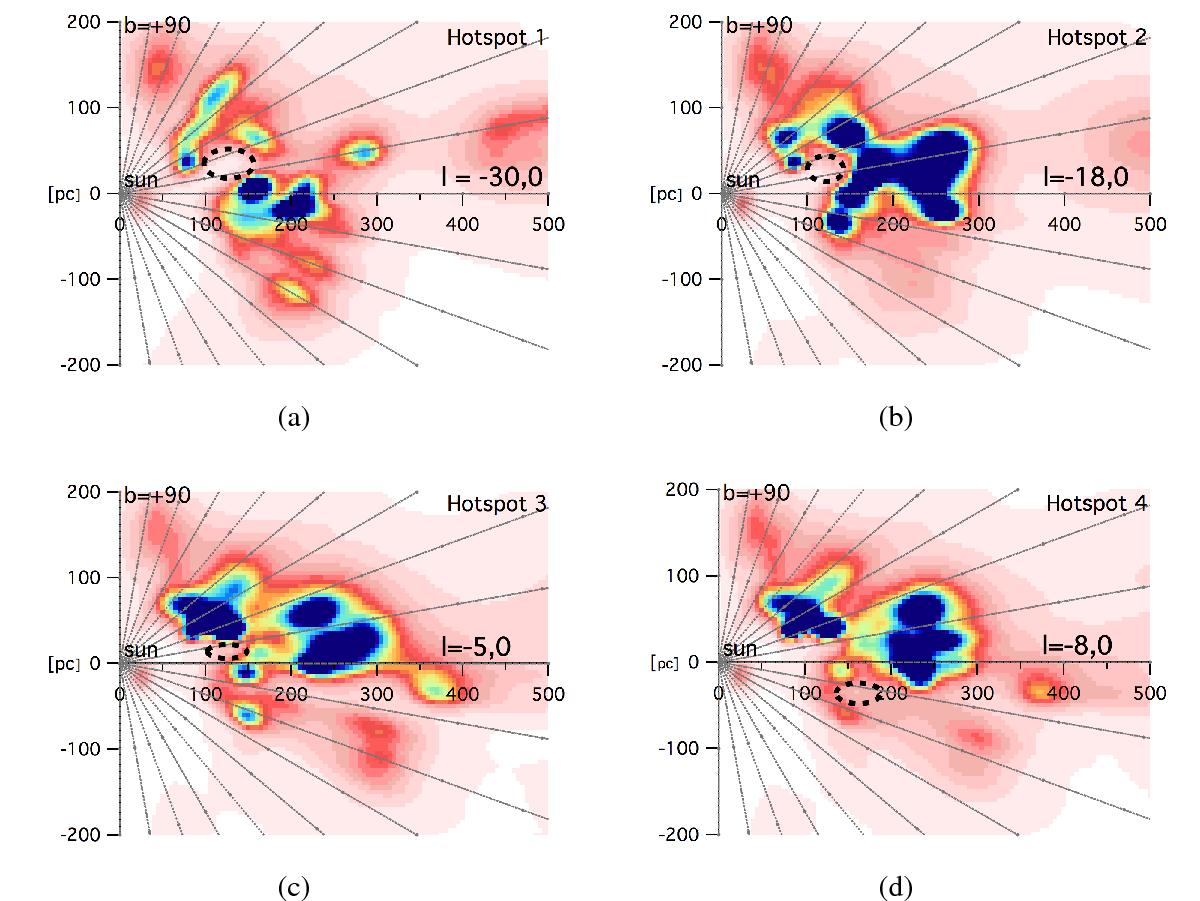
Four vertical planar cuts in the 3D opacity maps in planes containing the ROSAT 3/4 keV X-ray bright spots labeled 1 to 4 in Puspitarini et al. (2014) and here as a) to d); the black dashed ellipses show the likely locations of the corresponding SNRs; the latitudinal grid is every 10 deg.
This figure is made of several images, please see below:
Current usage metrics show cumulative count of Article Views (full-text article views including HTML views, PDF and ePub downloads, according to the available data) and Abstracts Views on Vision4Press platform.
Data correspond to usage on the plateform after 2015. The current usage metrics is available 48-96 hours after online publication and is updated daily on week days.
Initial download of the metrics may take a while.