Fig. 7
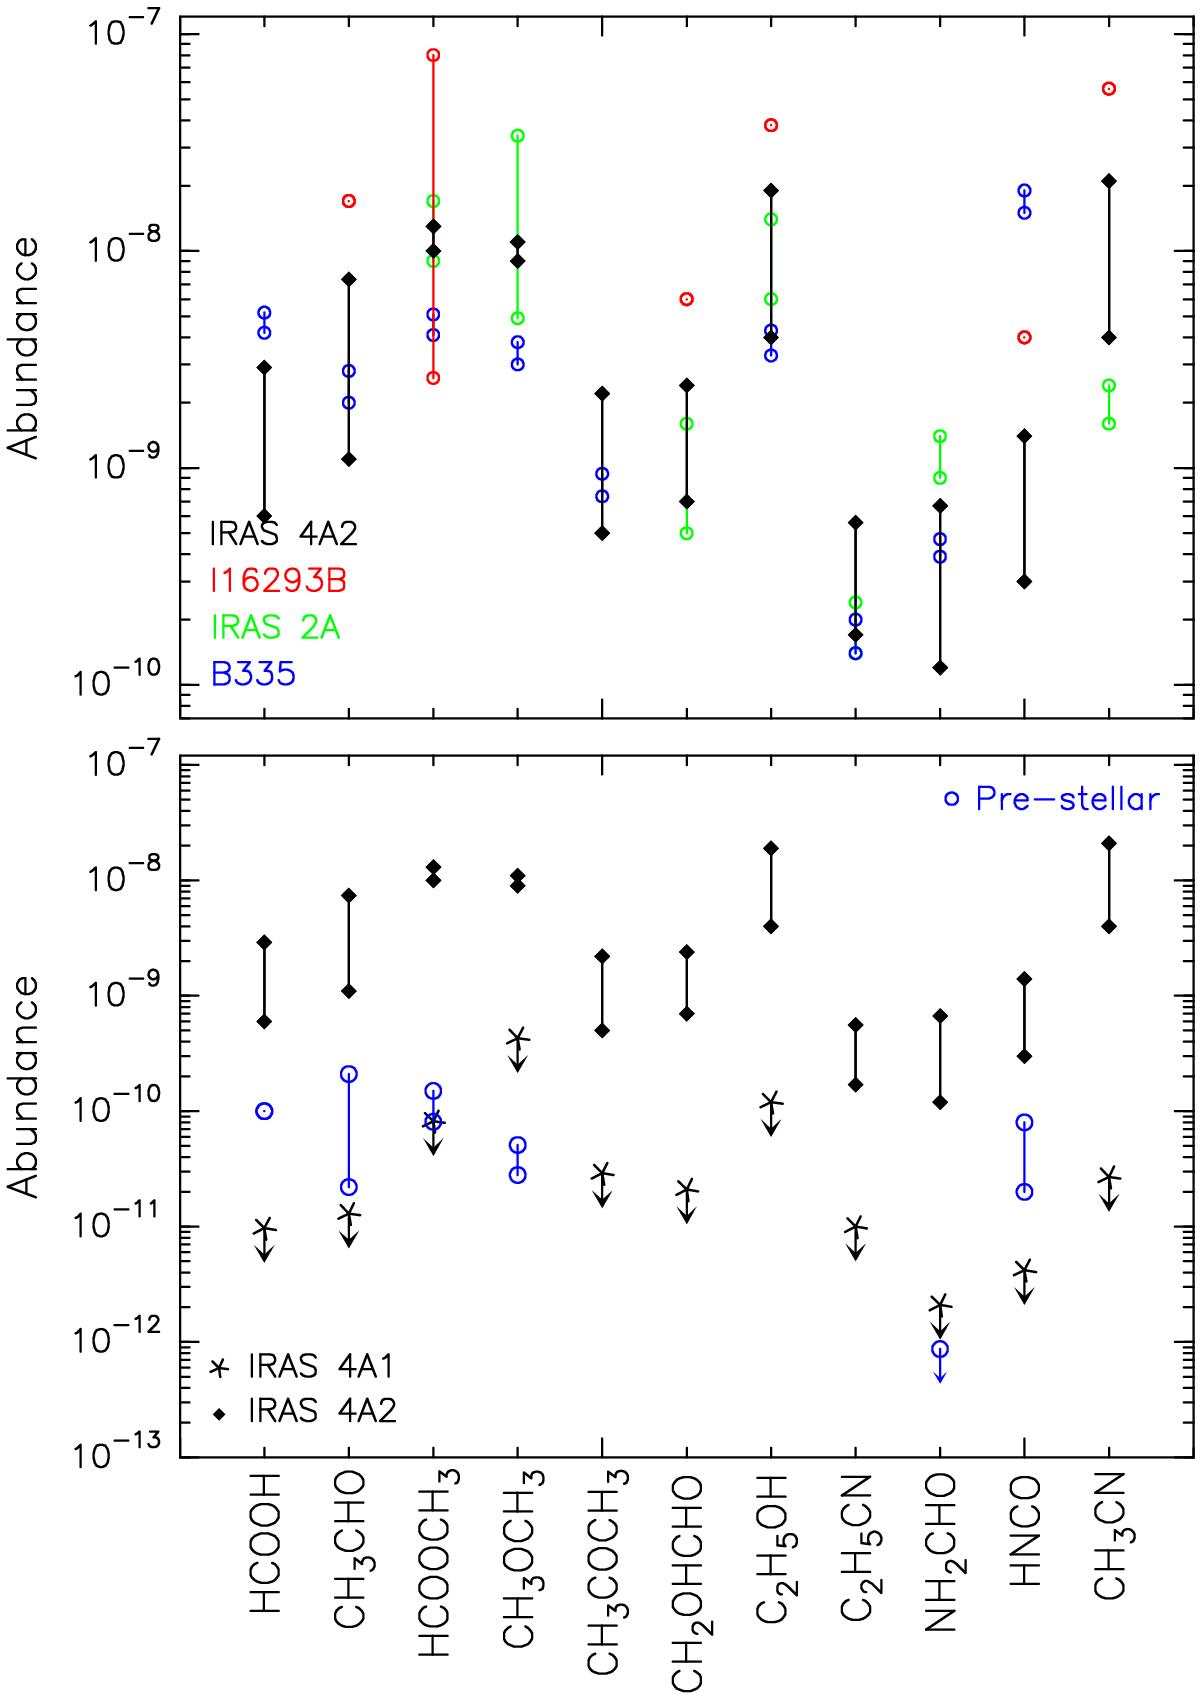
Top: molecular abundances with respect to H2 for the following hot corinos: IRAS 4A2 (black; this work), I16293B (red), IRAS 2A (green), and B335 (blue). All the values are derived from interferometric observations. References: I16293B: Bisschop et al. (2008), Jørgensen et al. (2012); IRAS 2A: Persson et al. (2012), Taquet et al. (2015); B335: Imai et al. (2016). Bottom: molecular abundances with respect to H2 derived in this work for IRAS 4A2 and IRAS 4A1 (upper limits). Blue symbols depict the values recently reported for the prestellar core L1544 by Vastel et al. (2014), López-Sepulcre et al. (2015), and Jiménez-Serra et al. (2016).
Current usage metrics show cumulative count of Article Views (full-text article views including HTML views, PDF and ePub downloads, according to the available data) and Abstracts Views on Vision4Press platform.
Data correspond to usage on the plateform after 2015. The current usage metrics is available 48-96 hours after online publication and is updated daily on week days.
Initial download of the metrics may take a while.