Fig. 5
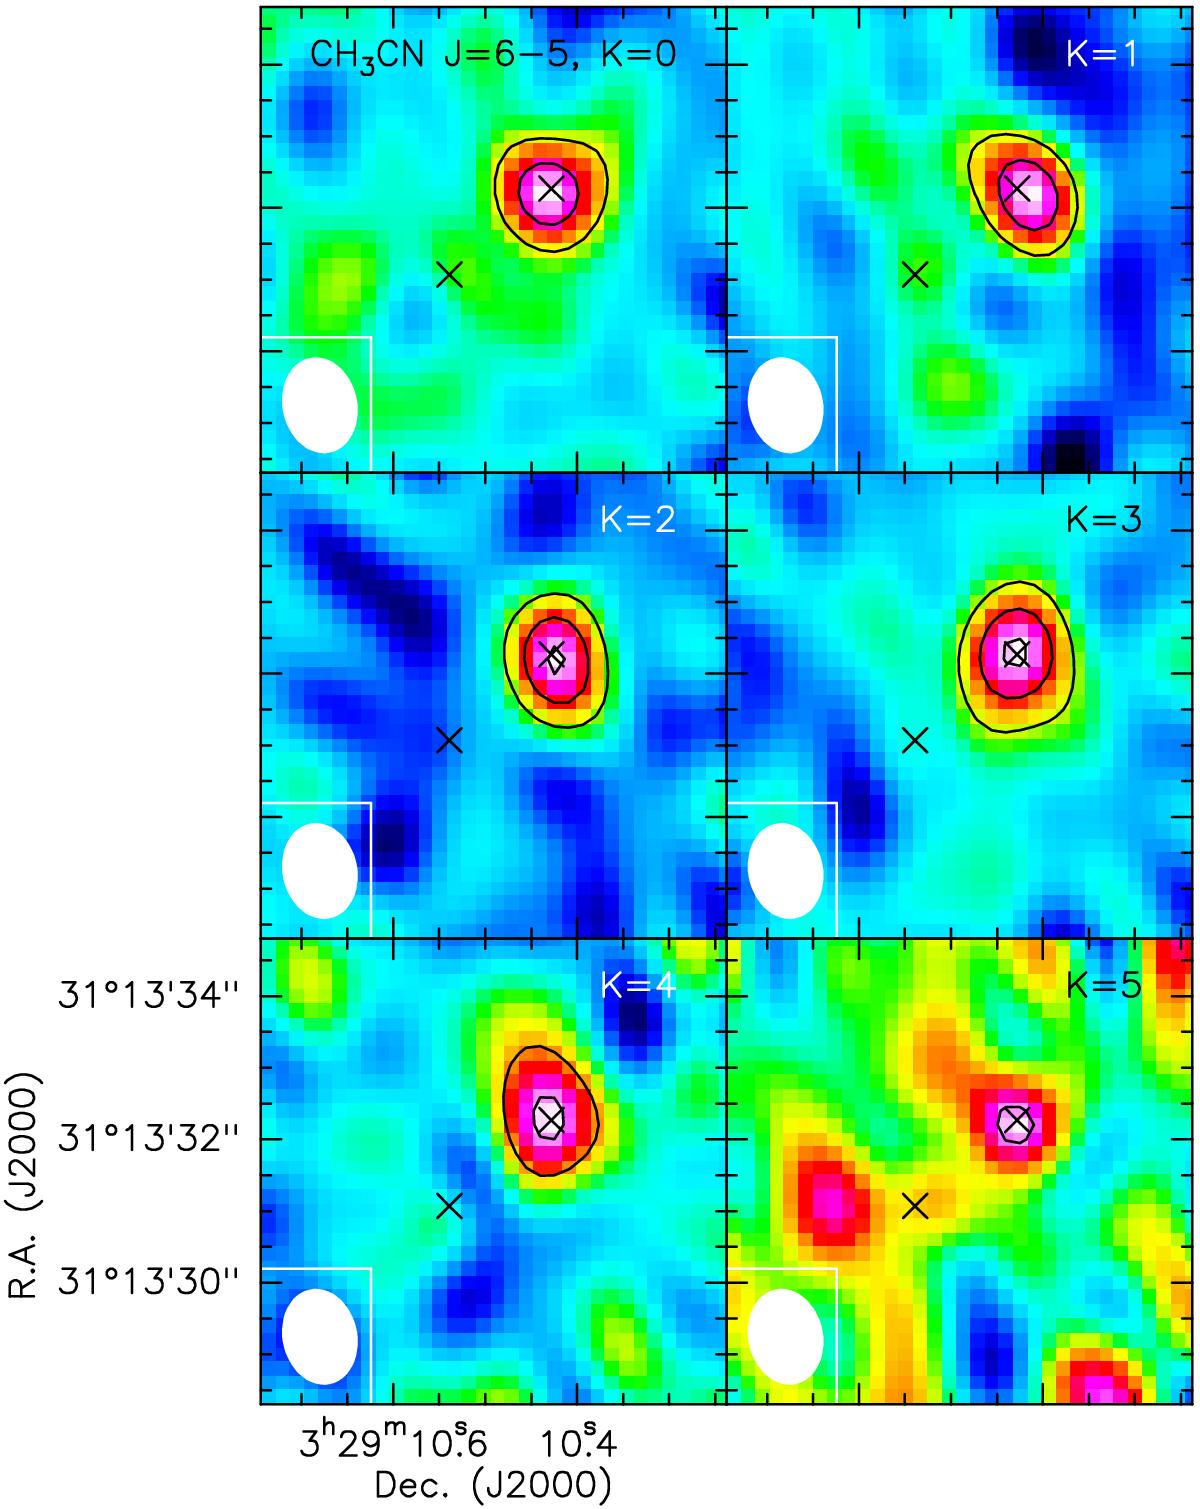
Moment 0 maps of the six CH3CN (J = 6 − 5) lines observed with PdBI. The transition is specified in each panel. The continuum peak position of A1 and A2 are indicated with black crosses. Contours start at 4σ and increase by steps of 4σ in all the maps. The values of σ for each map are summarised in Table 3. The synthesised beam is depicted in white in the lower left corner.
Current usage metrics show cumulative count of Article Views (full-text article views including HTML views, PDF and ePub downloads, according to the available data) and Abstracts Views on Vision4Press platform.
Data correspond to usage on the plateform after 2015. The current usage metrics is available 48-96 hours after online publication and is updated daily on week days.
Initial download of the metrics may take a while.