Fig. 3
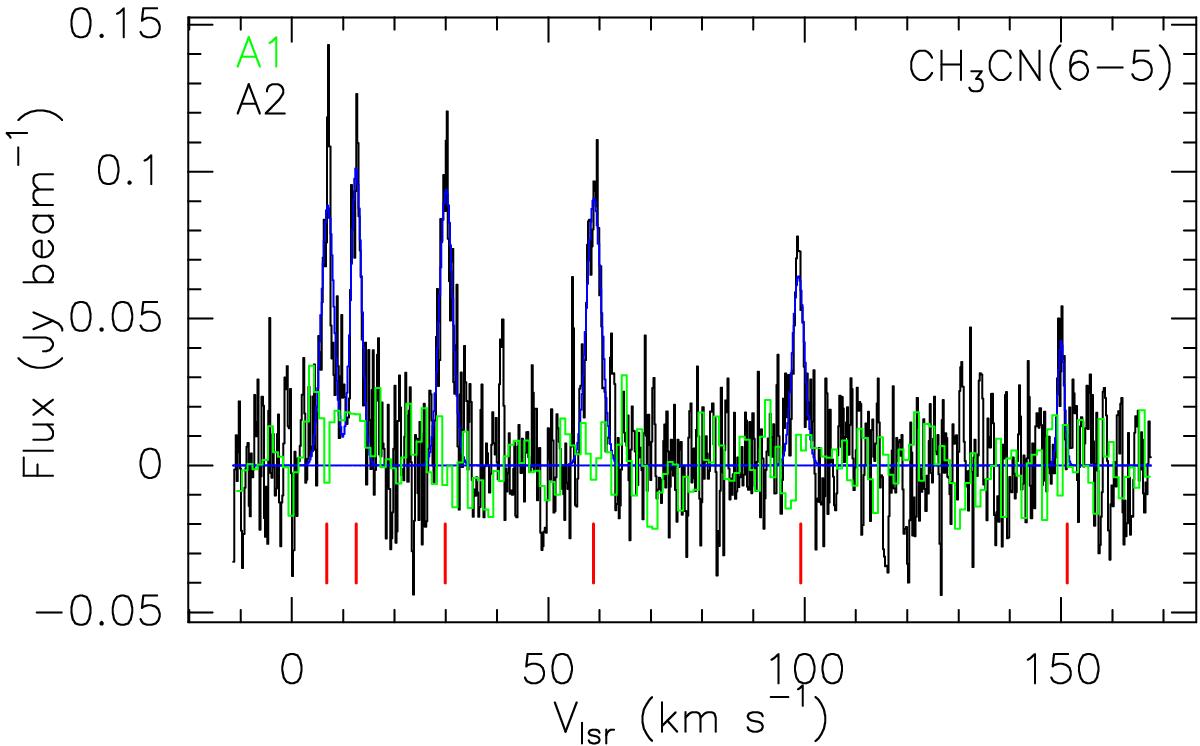
CH3CN(J = 6 − 5), K = 0–5 spectrum observed in IRAS 4A with PdBI, corresponding to the continuum peak coordinates of A1 (green) and A2 (black). The spectrum of A1 was smoothed to a channel width of 1 km s-1. The Gaussian fits to the lines detected in A2 are depicted in blue (see Table 2). The positions of the different K transitions, from K = 0 (left) to K = 5 (right), are indicated in red.
Current usage metrics show cumulative count of Article Views (full-text article views including HTML views, PDF and ePub downloads, according to the available data) and Abstracts Views on Vision4Press platform.
Data correspond to usage on the plateform after 2015. The current usage metrics is available 48-96 hours after online publication and is updated daily on week days.
Initial download of the metrics may take a while.