Free Access
Fig. 7
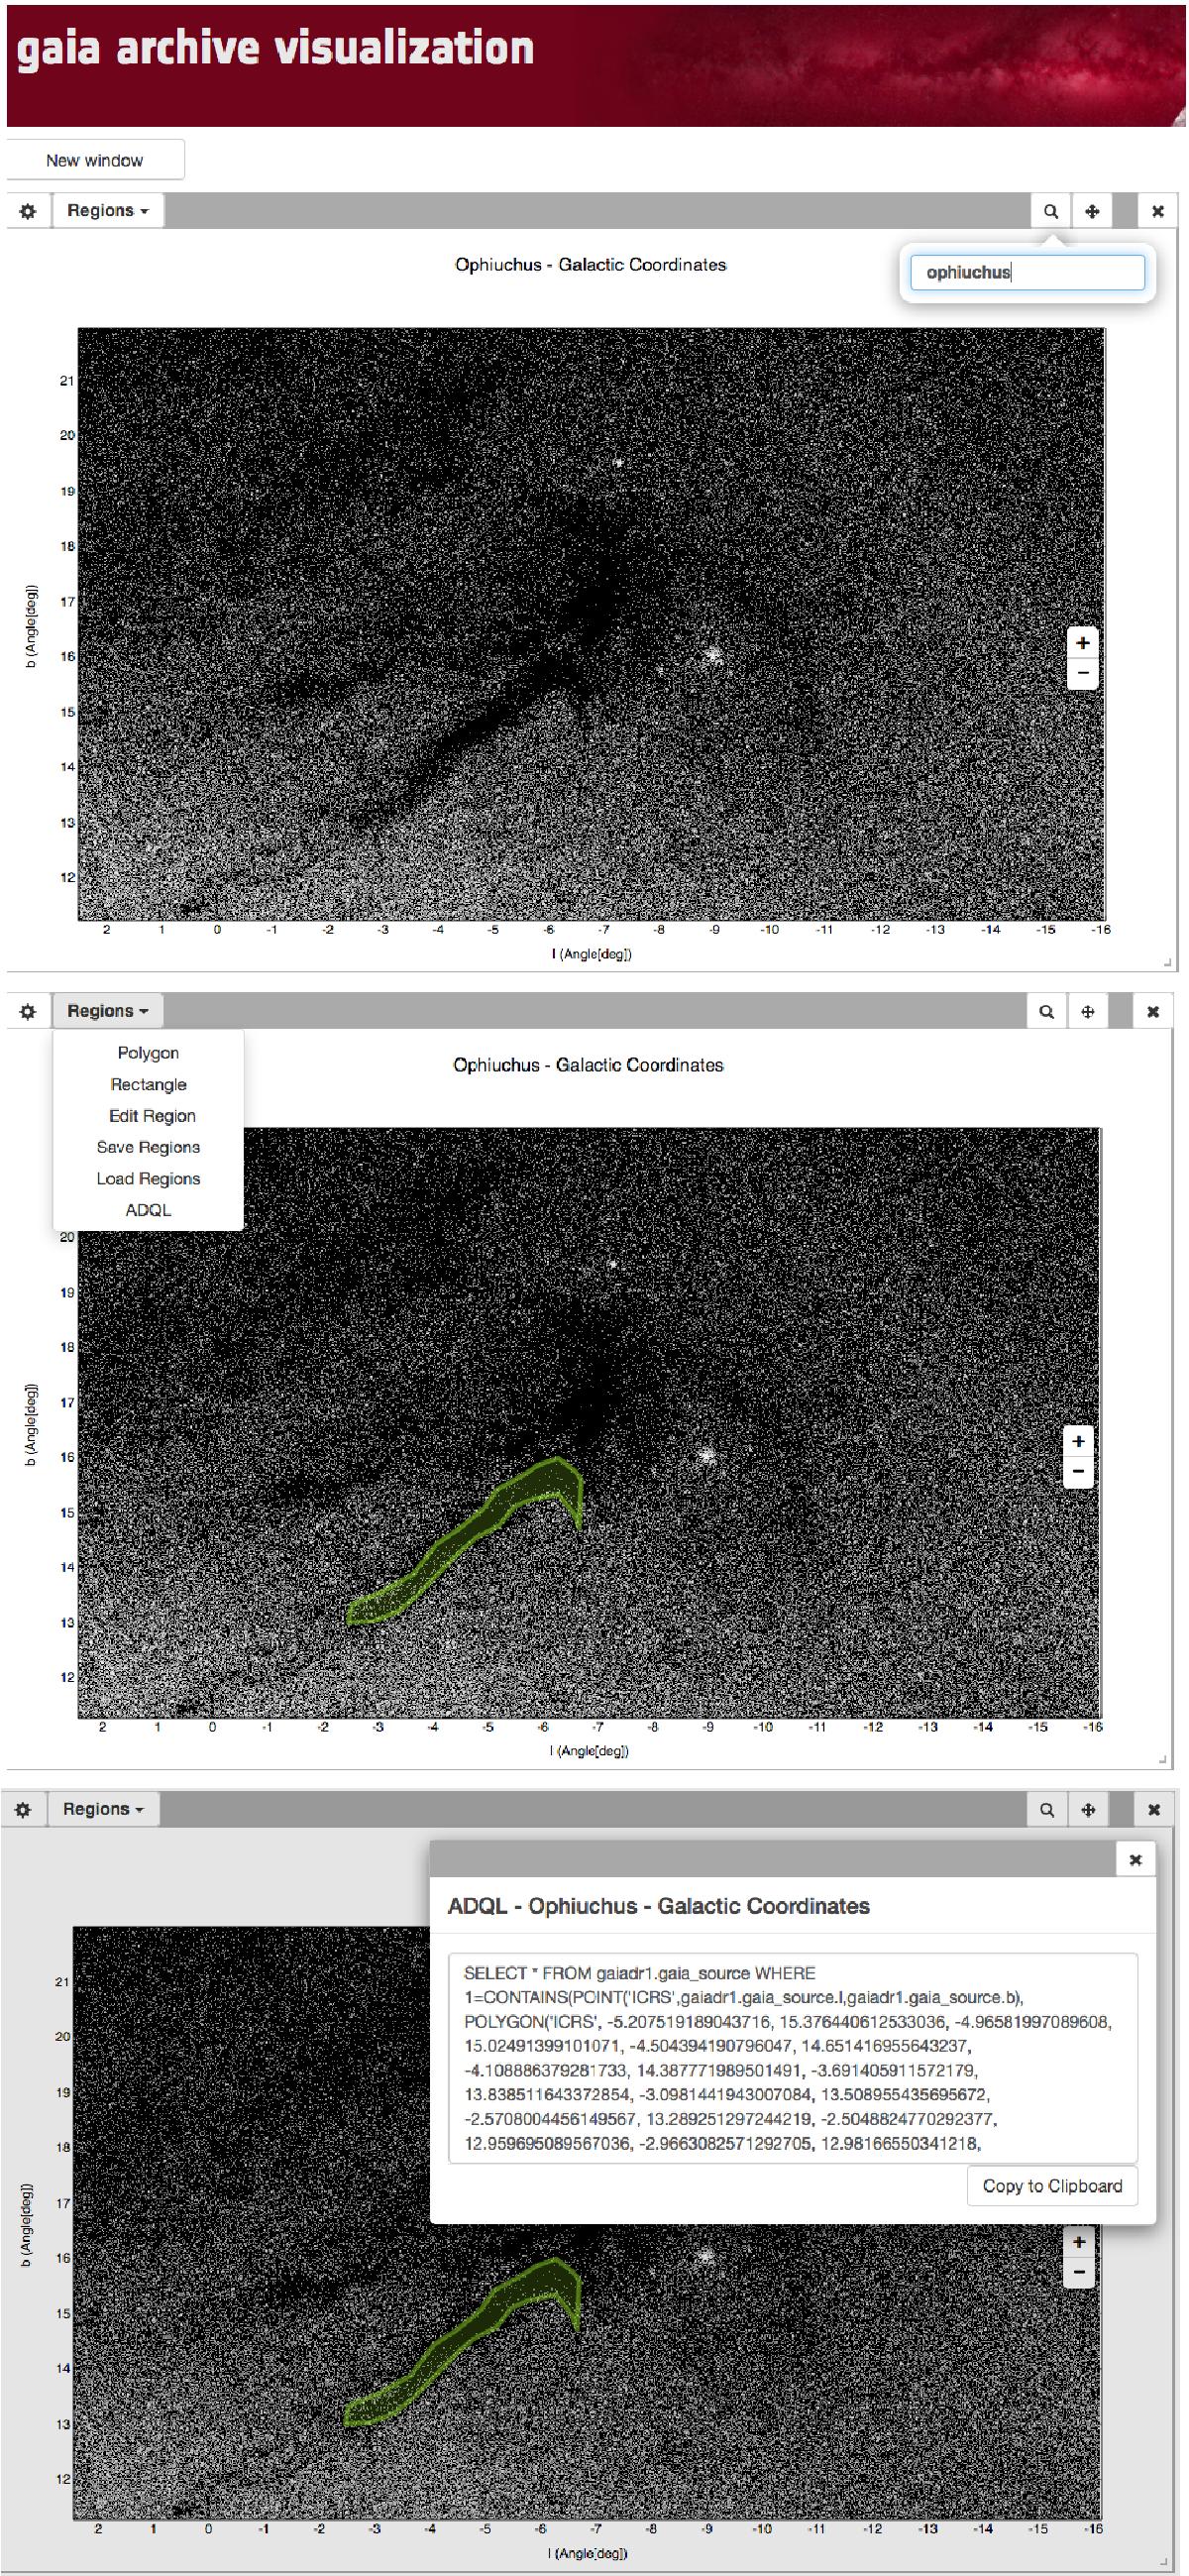
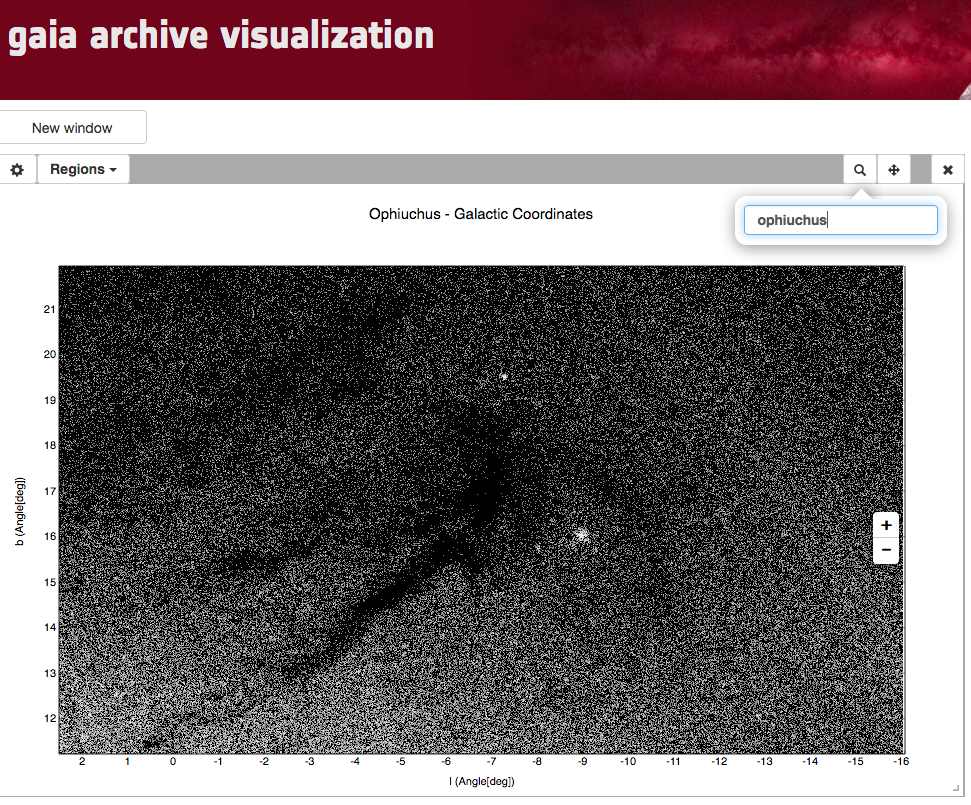
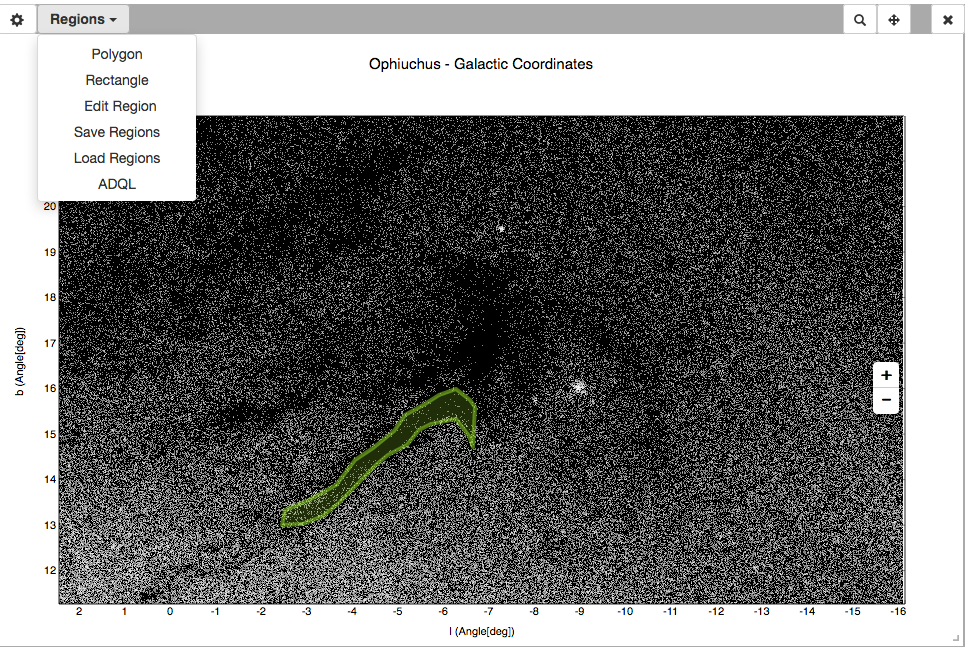
Workflow for producing a visual ADQL query. Top panel: user selects a region to centre the view (top). Middle panel: selected polygonal region is shown in green. Region menu with the ADQL functionality also displayed. Bottom panel: resulting ADQL query.
This figure is made of several images, please see below:
Current usage metrics show cumulative count of Article Views (full-text article views including HTML views, PDF and ePub downloads, according to the available data) and Abstracts Views on Vision4Press platform.
Data correspond to usage on the plateform after 2015. The current usage metrics is available 48-96 hours after online publication and is updated daily on week days.
Initial download of the metrics may take a while.