Fig. 8
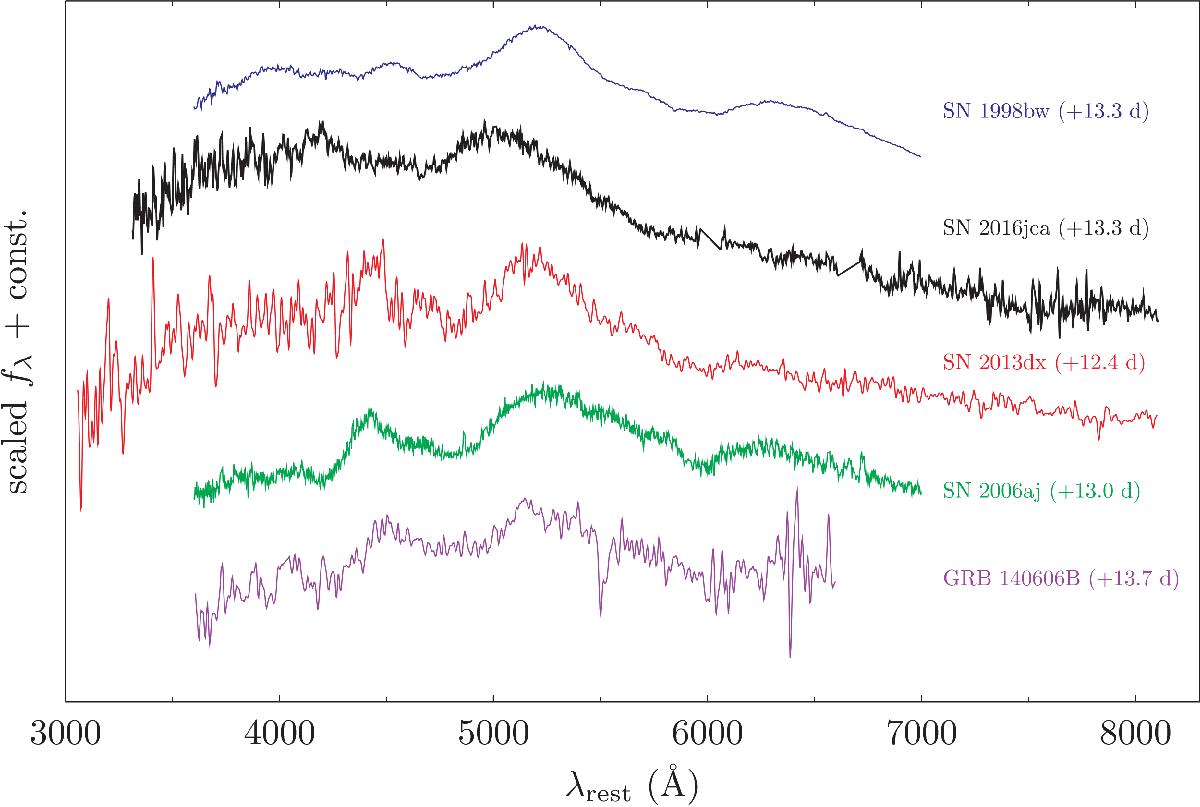
Comparison of the spectrum of SN 2016jca obtained with the GTC on 01-January-2017 (t − t0 = 13.3 days; shown in black), which was obtained near peak V-band light (+ 12.5 d, rest-frame). Plotted for comparison is a sample of GRB-SNe at similar post-explosion times: SN 1998bw (+ 13.3 days; blue), SN 2006aj (+ 13.0 days; green), SN 2013dx (+ 12.4 days; red) and the SN associated with GRB 140606B (+ 13.7 days; purple). All times and wavelengths are shown in the rest-frame. Visual inspection of the spectra reveals that the trough bluewards of the peak around 5000 ~ 5200 Å, which we attribute to blueshifted Fe ii λ5169, occurs at bluer wavelengths for SN 2016jca than all the comparison GRB-SNe, thus highlighting its high-velocity nature.
Current usage metrics show cumulative count of Article Views (full-text article views including HTML views, PDF and ePub downloads, according to the available data) and Abstracts Views on Vision4Press platform.
Data correspond to usage on the plateform after 2015. The current usage metrics is available 48-96 hours after online publication and is updated daily on week days.
Initial download of the metrics may take a while.