Free Access
Fig. 6
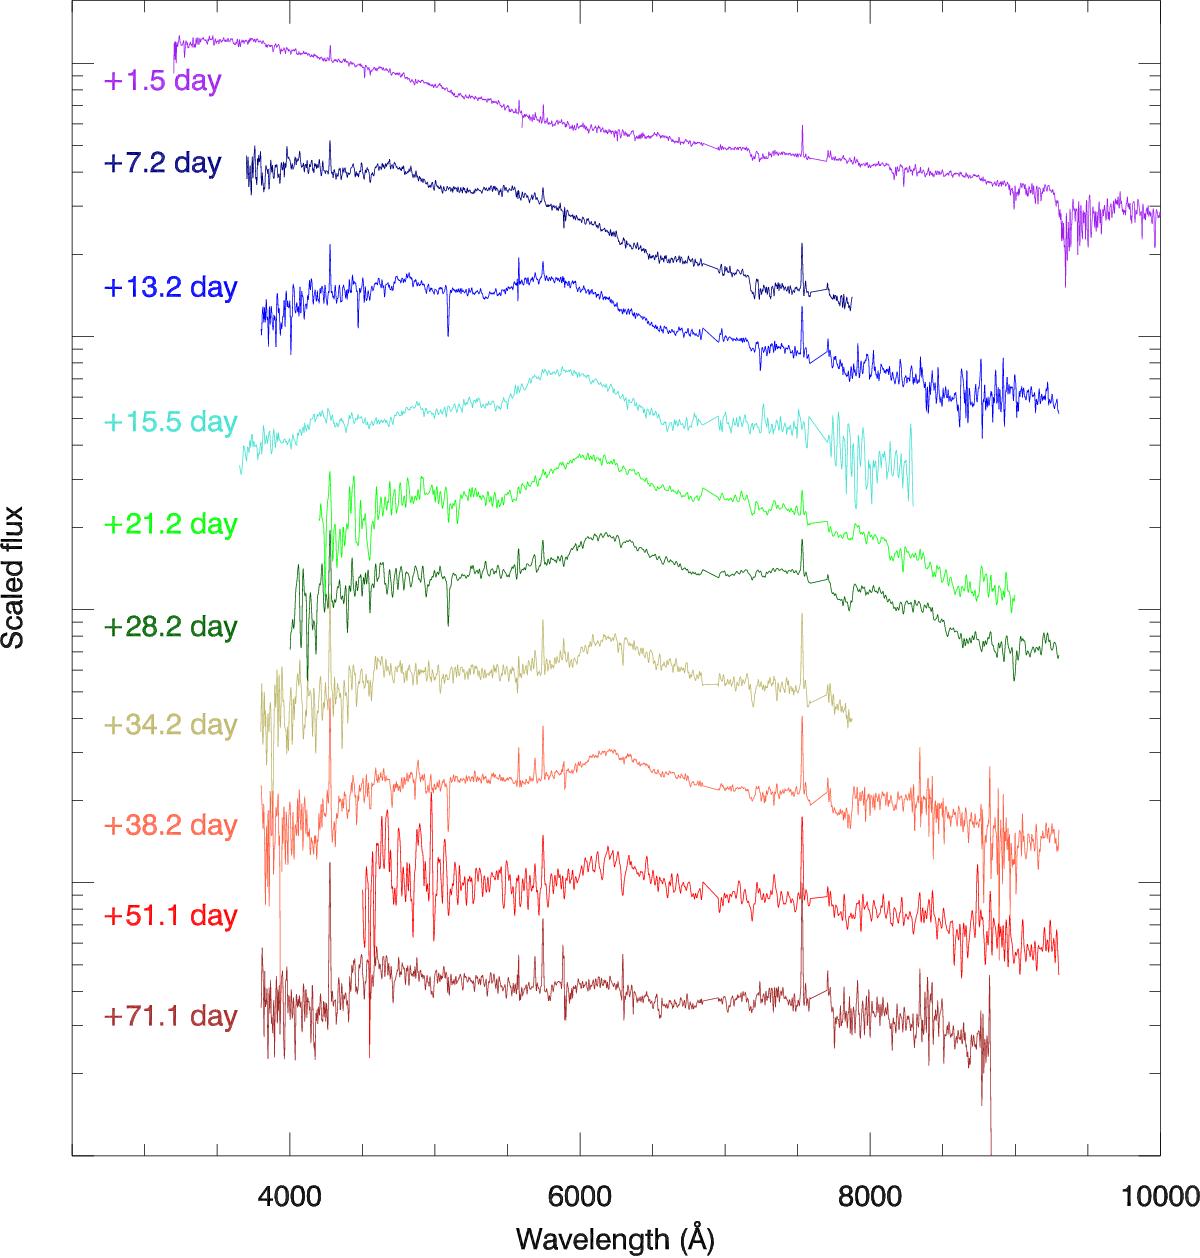
Spectroscopic time-series of GRB 161219B & SN 2016jca. Wavelengths and times are presented in the observer-frame (z = 0.1475), and are not host-subtracted. Narrow emission lines are seen, which arise from star-forming regions within the host galaxy.
Current usage metrics show cumulative count of Article Views (full-text article views including HTML views, PDF and ePub downloads, according to the available data) and Abstracts Views on Vision4Press platform.
Data correspond to usage on the plateform after 2015. The current usage metrics is available 48-96 hours after online publication and is updated daily on week days.
Initial download of the metrics may take a while.