Fig. 5
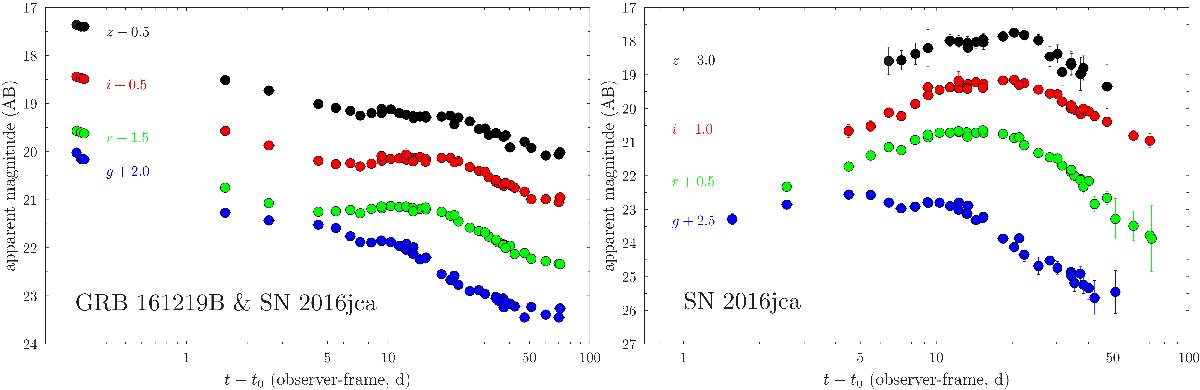
Observer-frame optical (griz) LCs of GRB 161219B/SN 2016jca. Left: LCs of the AG, SN and underlying host, which are uncorrected for extinction. The typical evolution from the AG-dominated to the SN-dominated phase is seen in all optical filters. Right: host- and AG-subtracted LCs of SN 2016jca. A pre-maximum bump is seen in the g-band, which peaks around ≈5–6 days. This bump is conspicuously absent in the other filters, and the origin of this flux excess is discussed in Sect. 9. In contrast, the potential bump seen in the z-band LC around 10 days is not real, but arises from instrumental defects.
Current usage metrics show cumulative count of Article Views (full-text article views including HTML views, PDF and ePub downloads, according to the available data) and Abstracts Views on Vision4Press platform.
Data correspond to usage on the plateform after 2015. The current usage metrics is available 48-96 hours after online publication and is updated daily on week days.
Initial download of the metrics may take a while.