Fig. 17
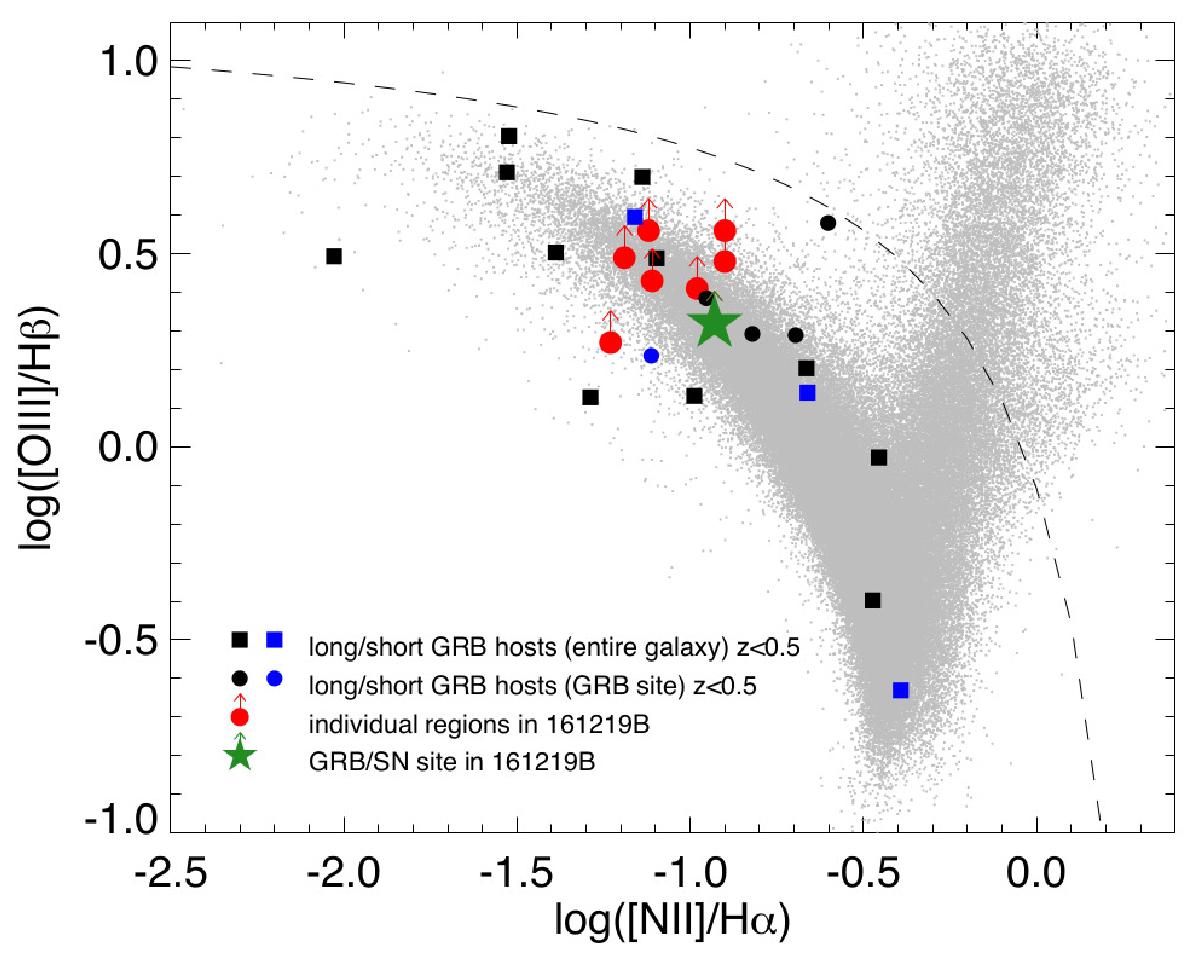
BPT diagram showing the different regions in the host of GRB 161219B, where the GRB site is highlighted by the green star. Values presented here are only lower limits as Hβ could not be measured due to its location on top of an atmospheric emission line. Grey dots are galaxies from SDSS (DR9), while the squares and dots are other GRB hosts/GRB sites (the latter for cases of resolved galaxies) at z< 0.5. The dashed line marks the dividing line between SF regions and those dominated by AGN activity. Data are taken from Christensen et al. (2008), Berger (2009), Han et al. (2010), Levesque et al. (2010), Perley et al. (2012), Thöne et al. (2014), de Ugarte Postigo et al. (2014b), Schulze et al. (2014), Stanway et al. (2015), Krühler et al. (2015).
Current usage metrics show cumulative count of Article Views (full-text article views including HTML views, PDF and ePub downloads, according to the available data) and Abstracts Views on Vision4Press platform.
Data correspond to usage on the plateform after 2015. The current usage metrics is available 48-96 hours after online publication and is updated daily on week days.
Initial download of the metrics may take a while.