Fig. 16
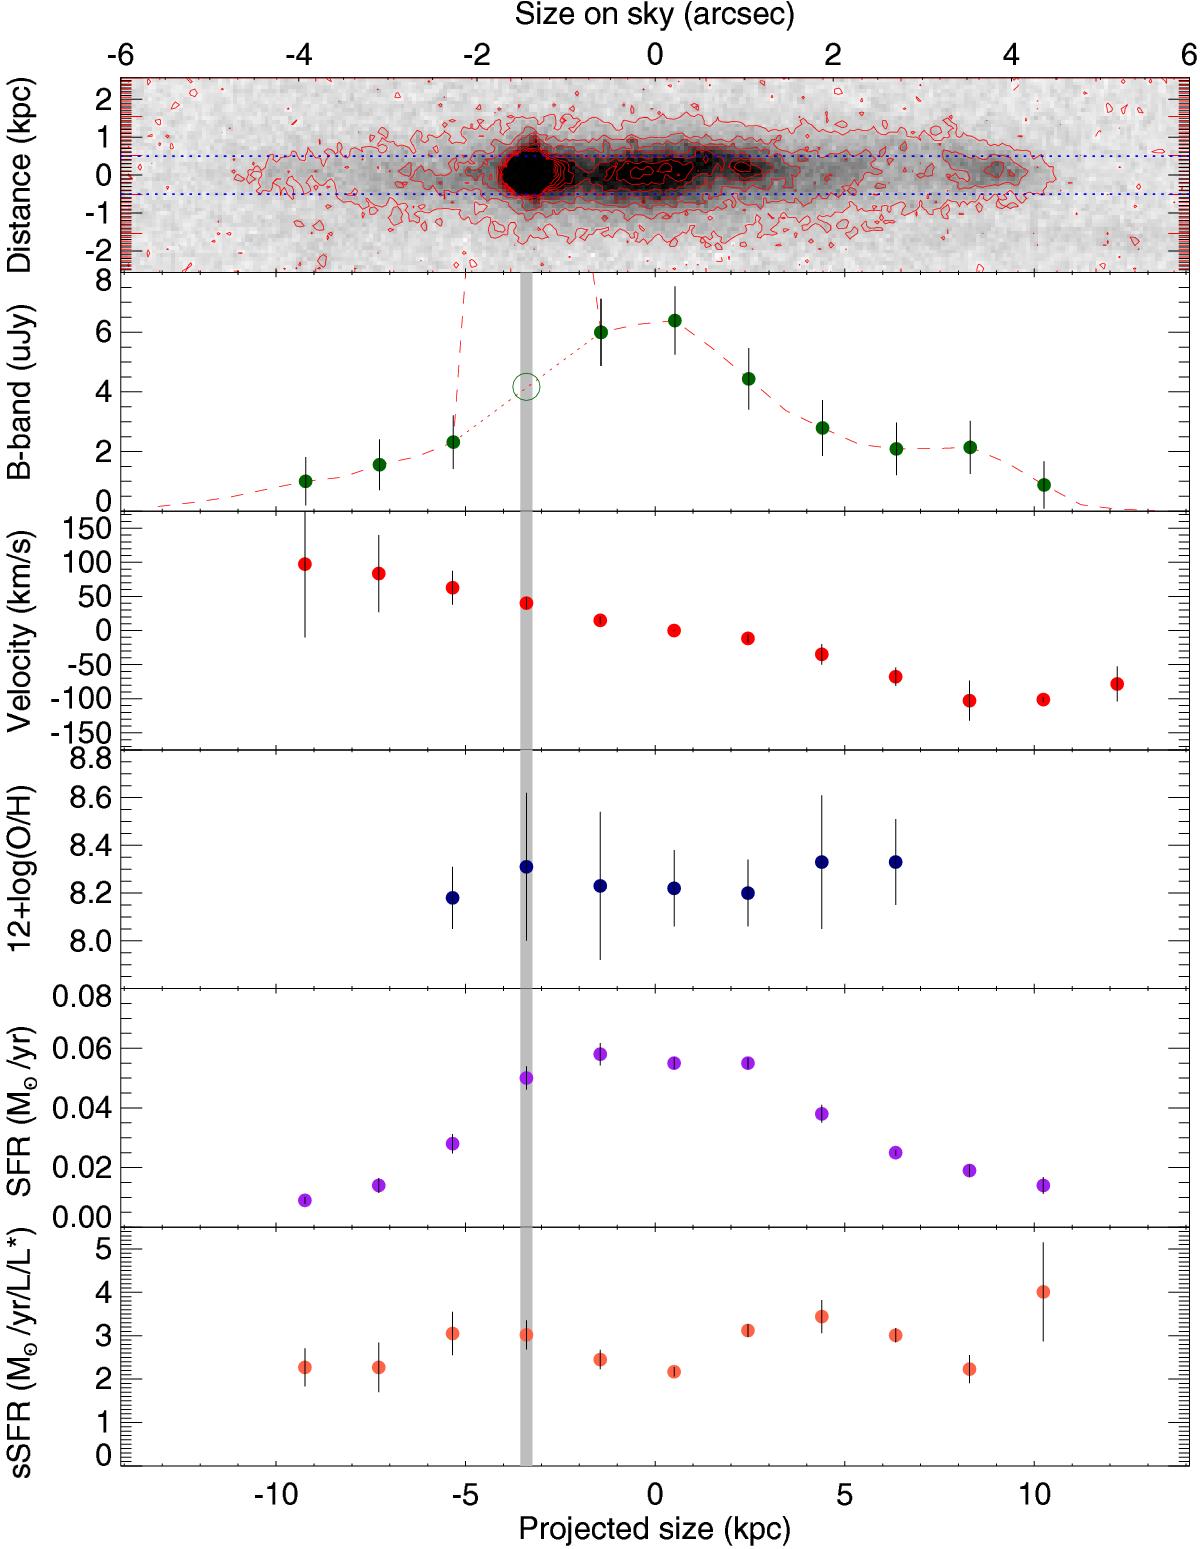
Host galaxy properties along the slit on the GTC observation of the 26 January 2017, as compared to the HST image. The first panel shows one of the HST images with contours superposed in red and the position and width of the GTC slit indicated by the dotted blue lines. The second panel is the B-band flux profile along the slit using the flux obtained from the 0th order L200LP grism from HST as reference. The third panel shows the relative velocity measured using the [O ii], [O iii] and Hα lines. The fourth panel shows the metallicity using the N2 parameter (Marino et al. 2013). The fifth panel shows the SFR derived from the Hα emission. The last panel is the SFR weighted by the B-band magnitude in panel 2. The vertical grey line marks the location of SN 2016jca.
Current usage metrics show cumulative count of Article Views (full-text article views including HTML views, PDF and ePub downloads, according to the available data) and Abstracts Views on Vision4Press platform.
Data correspond to usage on the plateform after 2015. The current usage metrics is available 48-96 hours after online publication and is updated daily on week days.
Initial download of the metrics may take a while.