Fig. 14
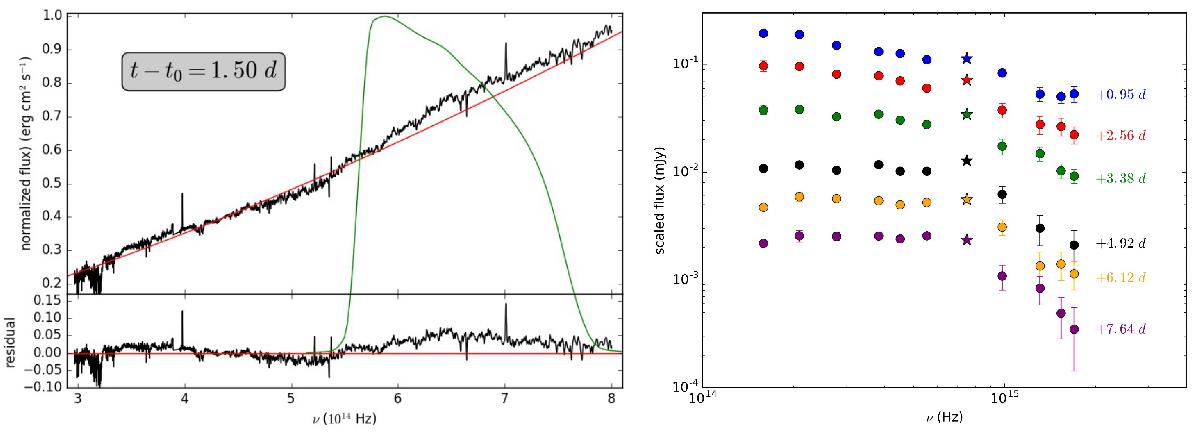
Inspection of the g-band excess. Left: XS spectrum obtained at t − t0 = 1.5 day (observer-frame). A SPL (red line) was fit to the spectrum in the wavelength range 6000 ≤ λ ≤ 9000 Å (3 − 5 × 10¹⁴ Hz). Between 3000 ~ 5500 Å (5.5 − 8 × 10¹⁴ Hz), excess above the best-fitting SPL is seen. Over-plotted is the g-band transmission curve, which shows that the excess occurs only in this filter. Right: optical & UV SED evolution (AG+SN+host), using data taken from our ground-based telescopes and Swift-UVOT. The g-band photometry are shown as stars. At early times (t − t0 = 0.95 day), little excess is seen in the g-band. However, between t − t0 = 2.56 − 6.12 days, a clear excess is seen, which disappears by 7.64 days. Intriguingly, excess is not seen in the bluer UVOT filters.
Current usage metrics show cumulative count of Article Views (full-text article views including HTML views, PDF and ePub downloads, according to the available data) and Abstracts Views on Vision4Press platform.
Data correspond to usage on the plateform after 2015. The current usage metrics is available 48-96 hours after online publication and is updated daily on week days.
Initial download of the metrics may take a while.