Fig. 13
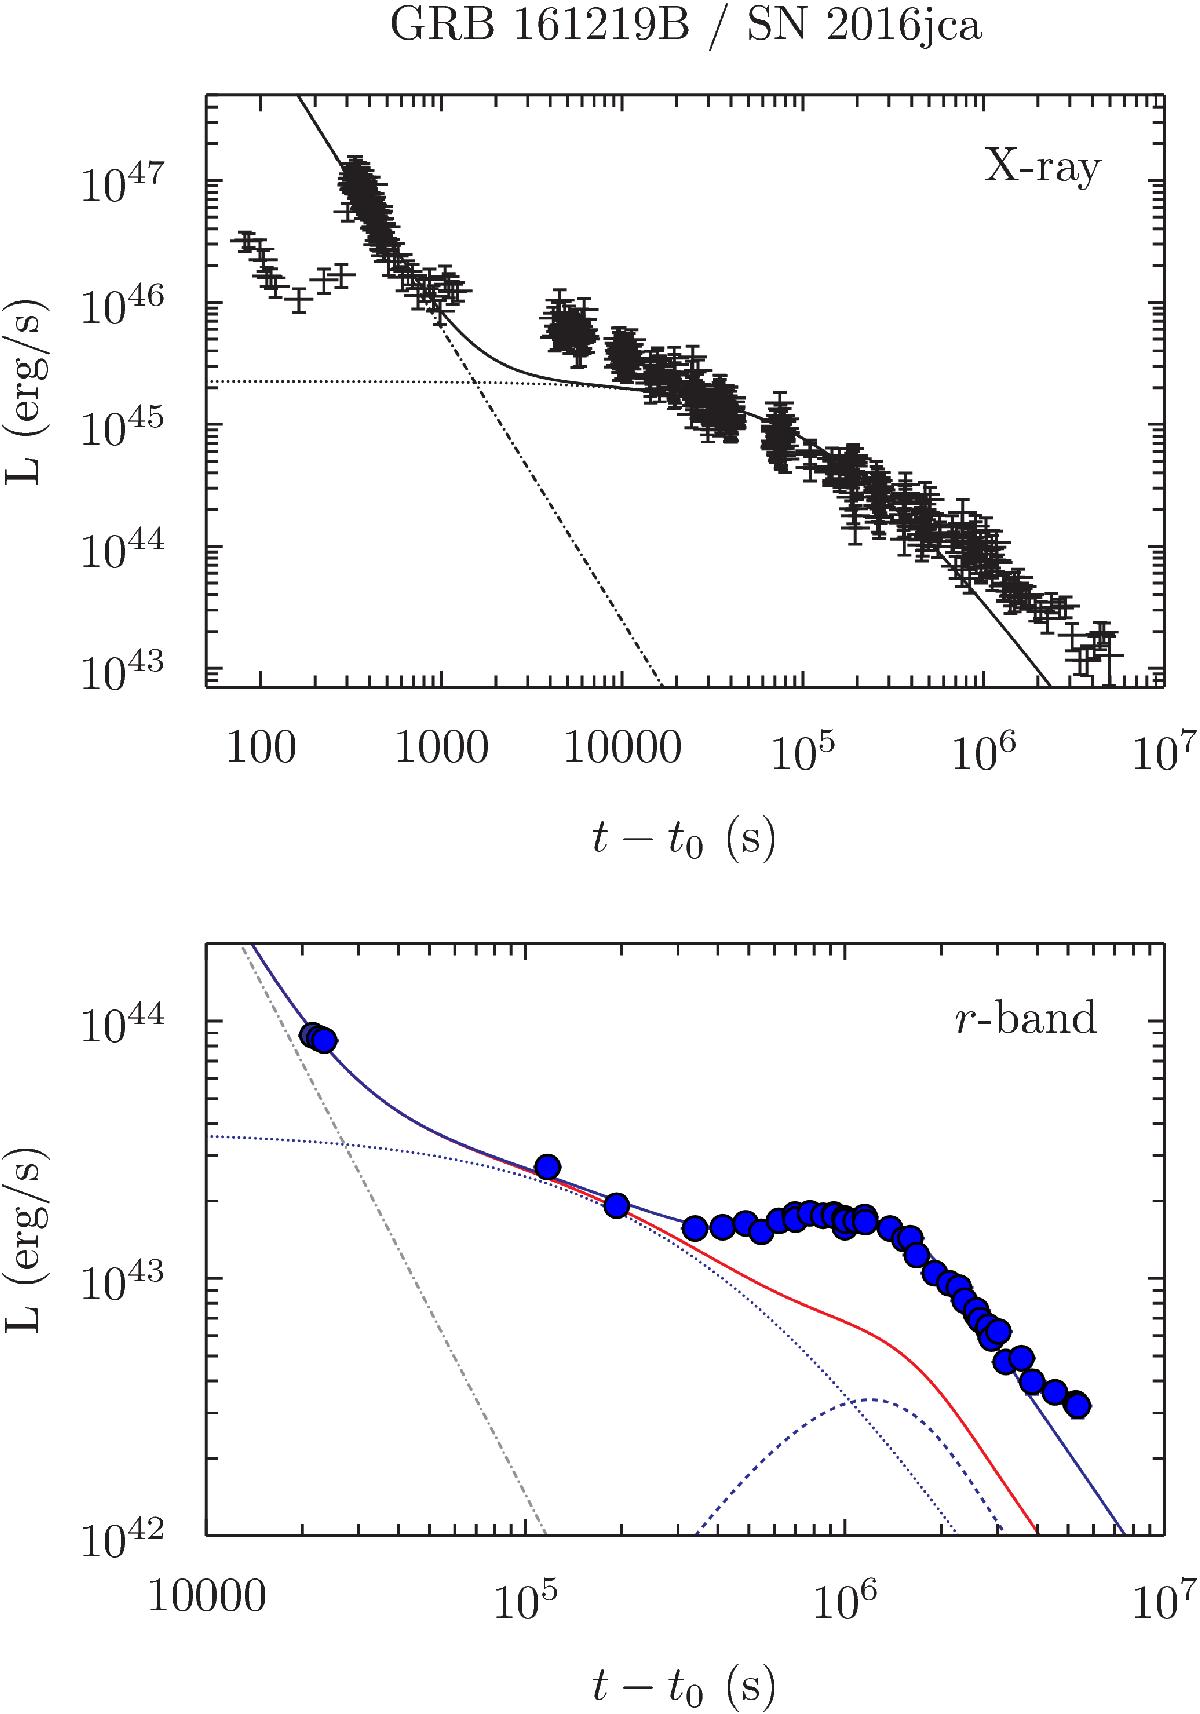
Magnetar model from Cano et al. (2016) fit to the X-ray (top) and r-band (bottom) luminosity LCs. Times are shown in the rest-frame. Top: sum of the SPL (dot-dashed line) and magnetar-powered AG (dotted line) phases is shown as the solid black line. Visual inspection shows that the model fails to reproduce the decay seen in the observations at t − t0> 3 × 10⁵ s. The best-fitting model gives B0 = (1.0 ± 0.1) × 1015 G, and P0 = 8.1 ± 0.3 ms. Bottom: sum of the SPL (dot-dashed line), magnetar-powered AG (dotted line) and magnetar-powered SN (dashed line) phases is shown as the solid red line. The solid blue line includes an additional multiplicative factor (Ψ) to get the magnetar-powered SN to match the observations. The best-fitting model gives B0 = (2.4 ± 0.3) × 1015 G, and P0 = 35.2 ± 3.0 ms, which are clearly discrepant with those determined from the X-ray. In addition, we found a diffusion time scale of tdiff = 9.43 ± 0.10 days, and Ψ = 4.2 ± 0.1. The conclusion is that the magnetar model cannot self-consistently explain the X-ray and optical observations of GRB 161219B/SN 2016jca. Even if SN 2016jca was powered in part by a magnetar central engine, an additional source of energy is needed to reproduce the observations, most likely a reservoir of radioactive nickel. The required nickel mass to get the model to match observations is MNi ~ 0.4M⊙.
Current usage metrics show cumulative count of Article Views (full-text article views including HTML views, PDF and ePub downloads, according to the available data) and Abstracts Views on Vision4Press platform.
Data correspond to usage on the plateform after 2015. The current usage metrics is available 48-96 hours after online publication and is updated daily on week days.
Initial download of the metrics may take a while.