Fig. 10
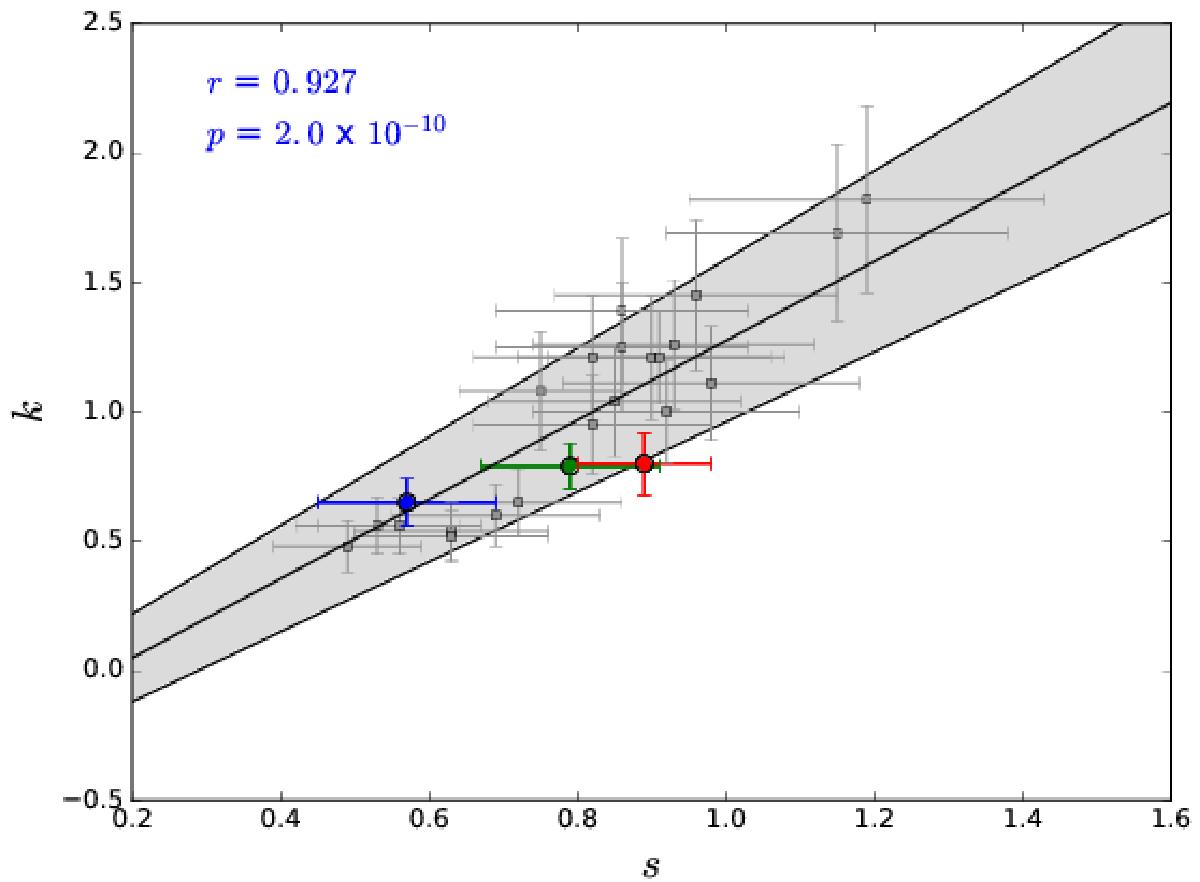
Luminosity (k)-stretch (s) relationship from Cano (2014). Plotted also are the rest-frame s and k values of SN 2016jca in B (blue), V (green) and R (red). The best-fitting is shown in black, and the 1σ error region is shown in shaded grey. The best-fitting values for the fitted line are found in the main text. The k and s values in R are marginally consistent within 1σ, while those in B and V are entirely consistent with the relationship.
Current usage metrics show cumulative count of Article Views (full-text article views including HTML views, PDF and ePub downloads, according to the available data) and Abstracts Views on Vision4Press platform.
Data correspond to usage on the plateform after 2015. The current usage metrics is available 48-96 hours after online publication and is updated daily on week days.
Initial download of the metrics may take a while.