Fig. 1
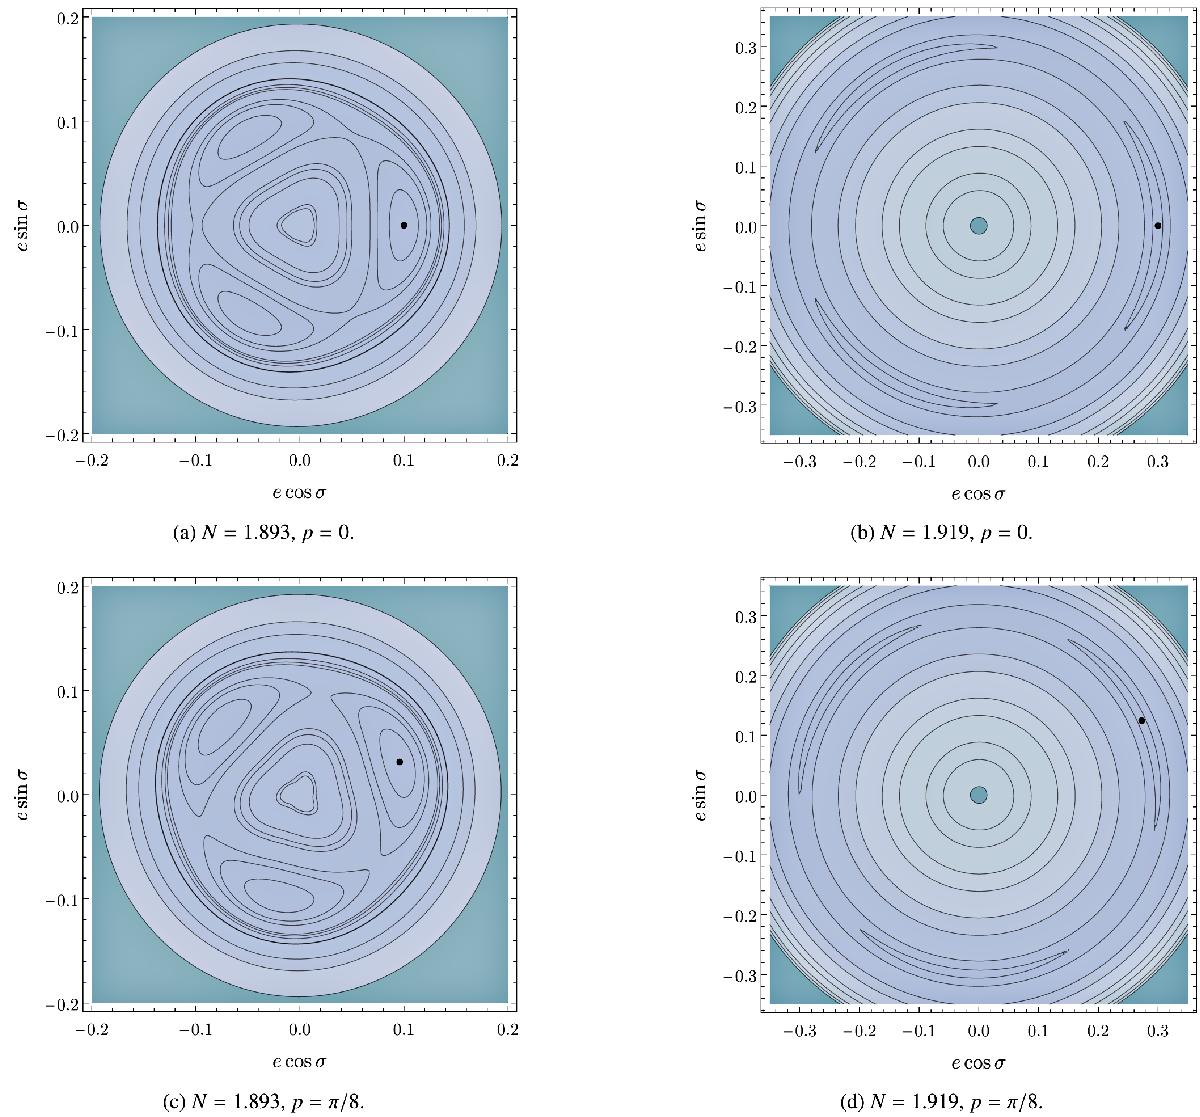
Level plots of the Hamiltonian ![]() on the (ecosσ,esinσ) plane for different values of N and p. This is the case of k′ = 4, k = 1, with e′ = 0.1, a′ = 1 AU, and μ = 10-3 for the perturber (in units where
on the (ecosσ,esinσ) plane for different values of N and p. This is the case of k′ = 4, k = 1, with e′ = 0.1, a′ = 1 AU, and μ = 10-3 for the perturber (in units where ![]() ). The black dot in each panel indicates the position of the stable equilibrium point that is found by our algorithm. The function
). The black dot in each panel indicates the position of the stable equilibrium point that is found by our algorithm. The function ![]() is periodic in σ with period 2π/ (k′ − k), so there will always be k′ − k equivalent stable equilibra one rotation away from each another. We note that eeq increases with N, while p has the effect of simply rotating the diagram.
is periodic in σ with period 2π/ (k′ − k), so there will always be k′ − k equivalent stable equilibra one rotation away from each another. We note that eeq increases with N, while p has the effect of simply rotating the diagram.
Current usage metrics show cumulative count of Article Views (full-text article views including HTML views, PDF and ePub downloads, according to the available data) and Abstracts Views on Vision4Press platform.
Data correspond to usage on the plateform after 2015. The current usage metrics is available 48-96 hours after online publication and is updated daily on week days.
Initial download of the metrics may take a while.