Free Access
Fig. A.2
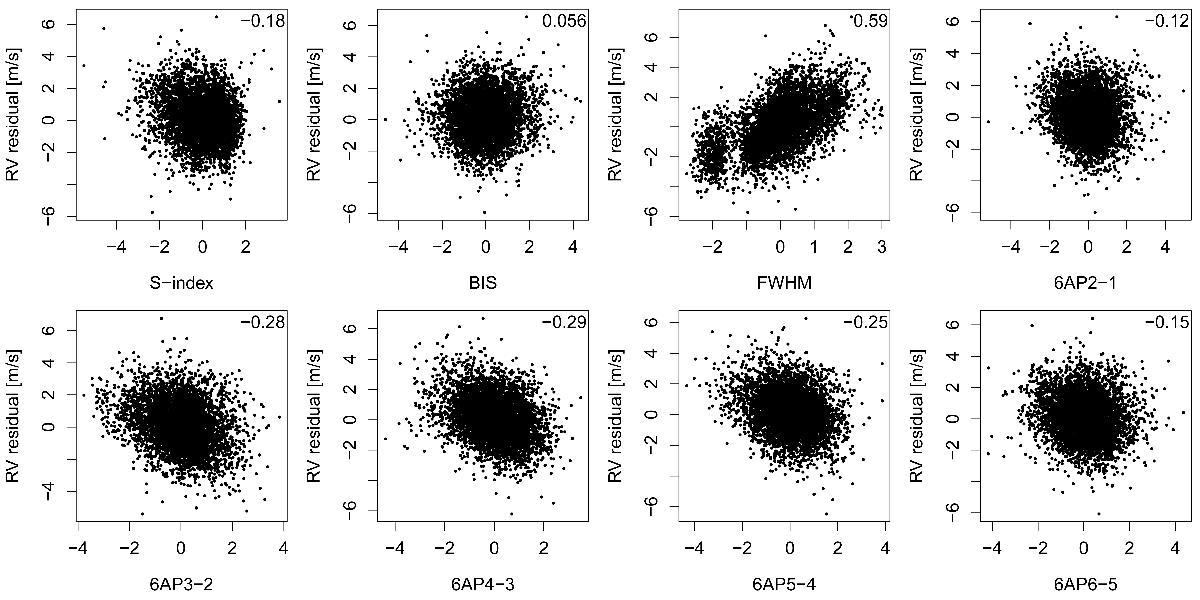
Correlation between RV residuals and noise proxies. The RV residuals for a given proxy are calculated by subtracting the best-fitting six-planet model from the 1AP1 data set, where the linear parameter corresponding to the proxy is set to zero. The Pearson correlation coefficient is shown in the top right corner.
Current usage metrics show cumulative count of Article Views (full-text article views including HTML views, PDF and ePub downloads, according to the available data) and Abstracts Views on Vision4Press platform.
Data correspond to usage on the plateform after 2015. The current usage metrics is available 48-96 hours after online publication and is updated daily on week days.
Initial download of the metrics may take a while.