Free Access
Fig. 7
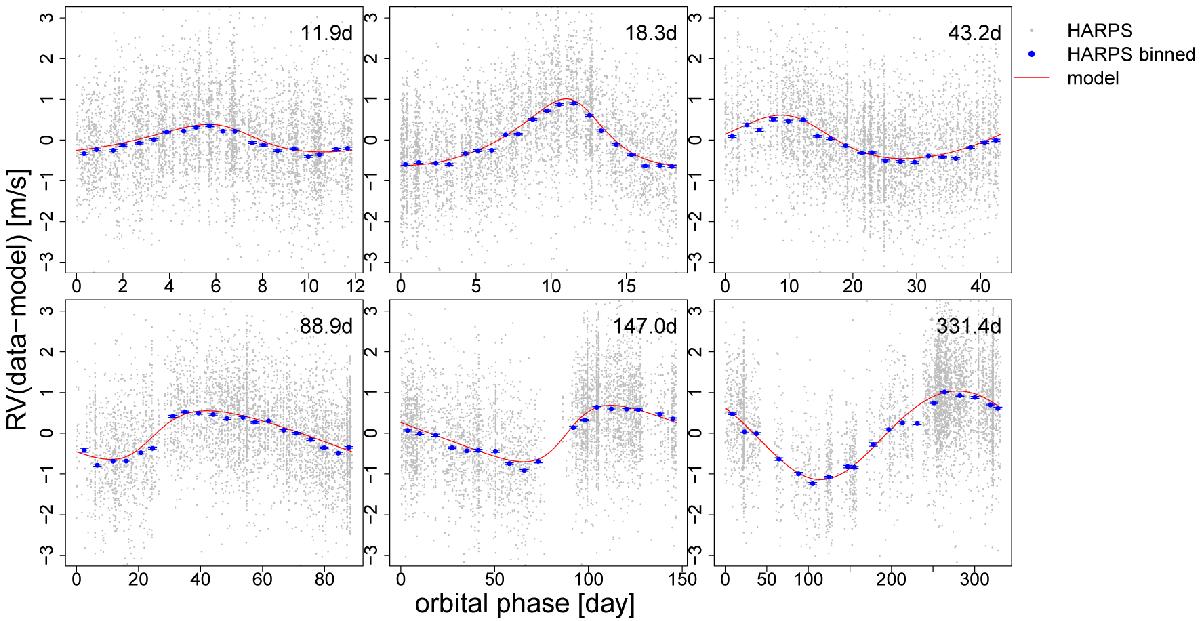
Phase-folded data and planet model prediction. For the signal shown in each panel, the noise components and other signals are subtracted from the data. For each panel, the phase-folded times are original observation times mod the optimal period with respect to the minimum observation time.
Current usage metrics show cumulative count of Article Views (full-text article views including HTML views, PDF and ePub downloads, according to the available data) and Abstracts Views on Vision4Press platform.
Data correspond to usage on the plateform after 2015. The current usage metrics is available 48-96 hours after online publication and is updated daily on week days.
Initial download of the metrics may take a while.