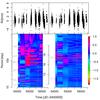
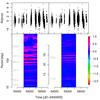
Fig. 6

Noise-subtracted RVs (top panels) and the moving MLP-based periodograms (bottom panels) made within the 1000 d (left panels) and 2000 d (right panels) moving window. In each moving periodogram, the bottom left panel shows the periodogram for periods ranging from 10 d to 1000 d while the bottom right panel is focused on visualization of periods below 30 d. The colors encode the RML which is truncated to optimize the visualization of signals. The periods of signals identified in the 6-planet Keplerian solution are shown by horizontal dashed lines. The logarithmic ML is truncated to optimize the visualization of signals.
Current usage metrics show cumulative count of Article Views (full-text article views including HTML views, PDF and ePub downloads, according to the available data) and Abstracts Views on Vision4Press platform.
Data correspond to usage on the plateform after 2015. The current usage metrics is available 48-96 hours after online publication and is updated daily on week days.
Initial download of the metrics may take a while.