Fig. 7
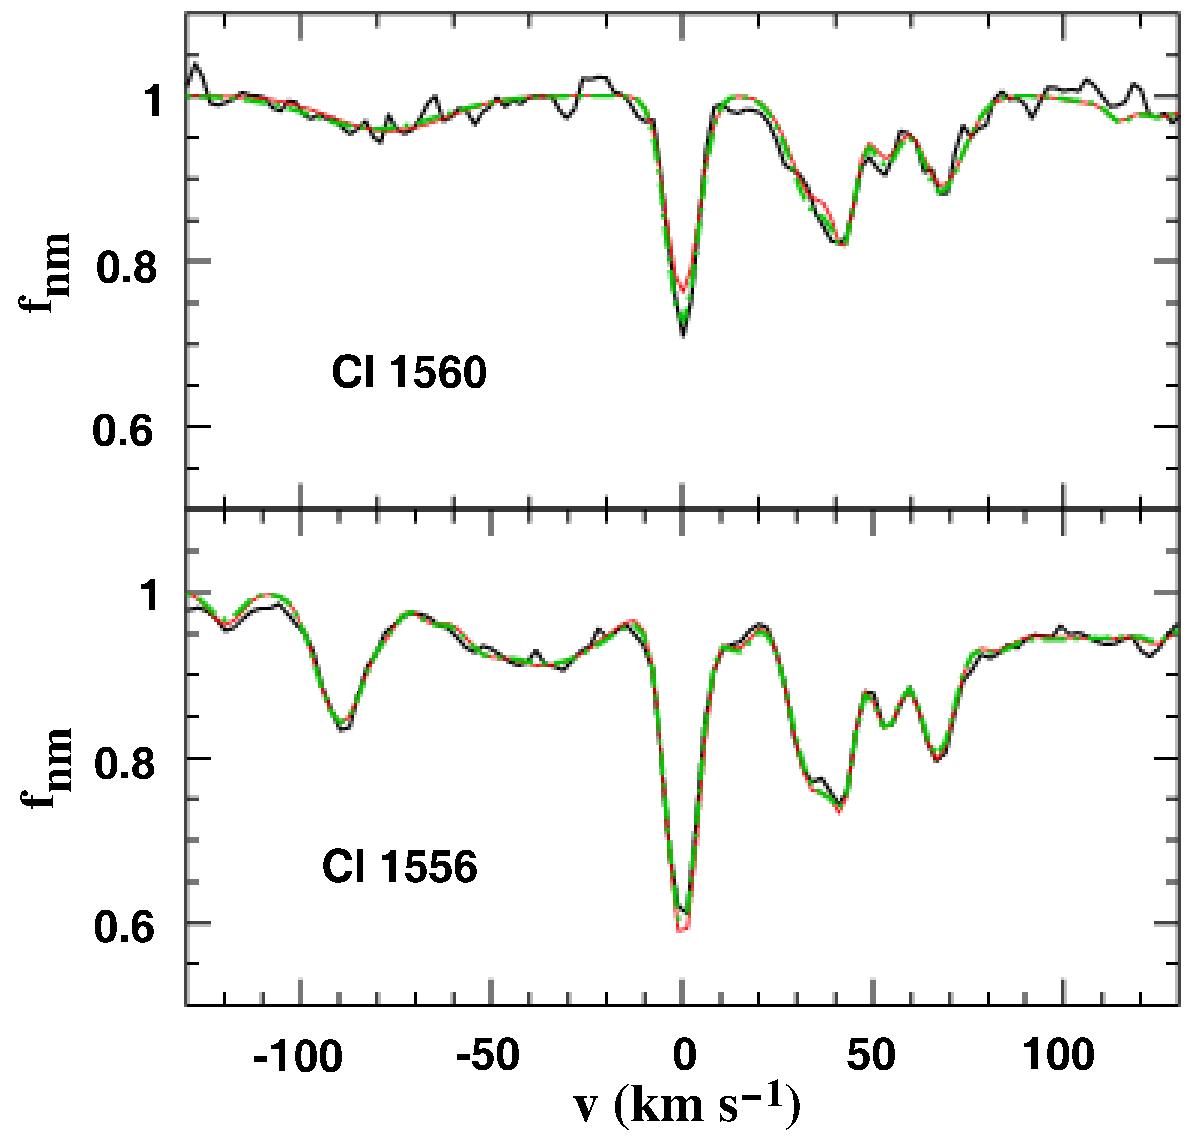
Intervening C i absorption towards the quasar PKS 0237−23: spectrum (black curve) and simultaneous fit to the two transitions (red curve). The green curves correspond to a fit with a spatial coverage factor Cf = 0.85 of the Lyα emission line. In the bottom panel, bluewards of C iλ1560 line (which falls at the top of Lyα emission) C ivλ1550 absorption at zabs = 1.52580 is present as well as a weak, somewhat broad Lyα absorption. At vhelio = 0 km s-1, the redshift is z = 1.364695.
Current usage metrics show cumulative count of Article Views (full-text article views including HTML views, PDF and ePub downloads, according to the available data) and Abstracts Views on Vision4Press platform.
Data correspond to usage on the plateform after 2015. The current usage metrics is available 48-96 hours after online publication and is updated daily on week days.
Initial download of the metrics may take a while.