Fig. 5
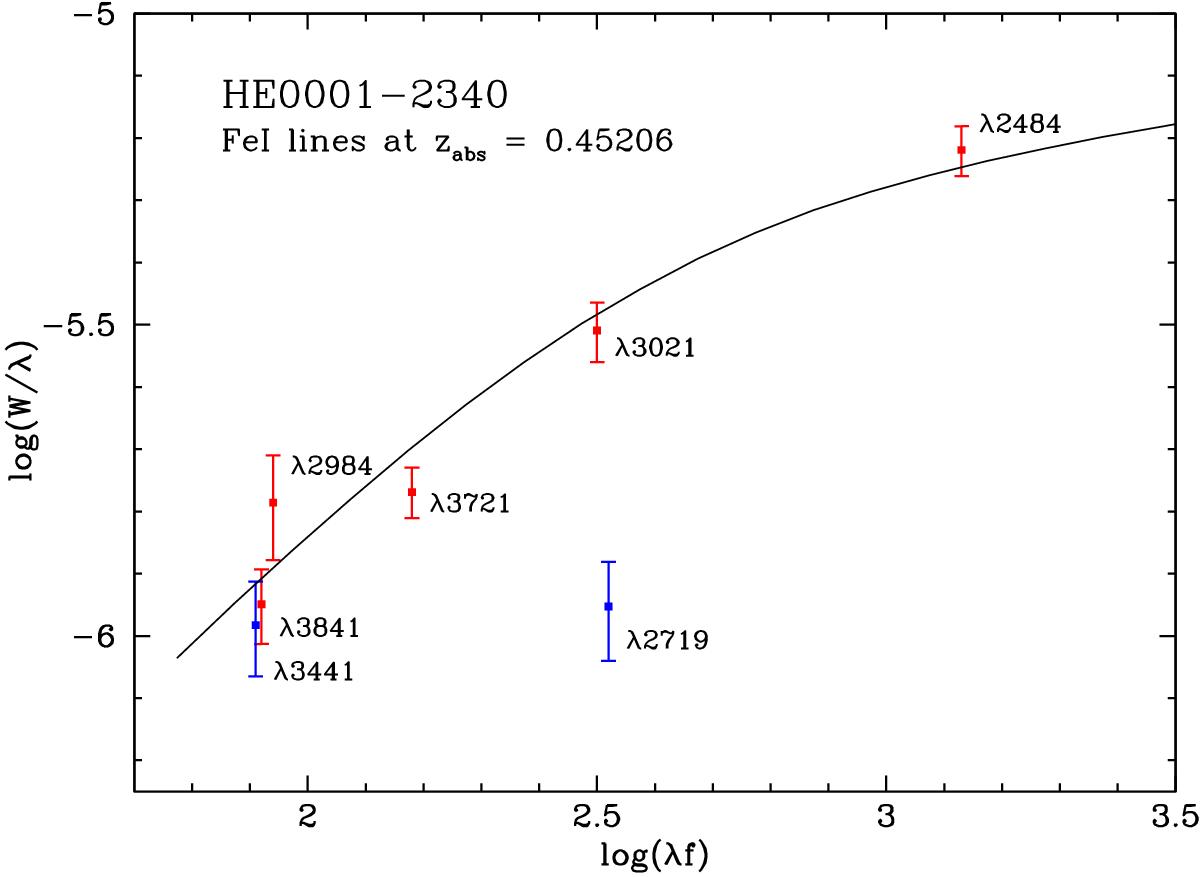
Curve of growth for the Fe i transitions detected in the zabs = 0.45206 system towards HE 0001−2340. For each point we indicate the rest wavelength of the Fe i transition involved. The smooth curve corresponds to b = 0.55 km s-1 and log N(Fe i) = 12.289 (see text). The red and blue points correspond to transitions seen on the quasar continuum and emission lines, respectively. The Fe iλ2719 line falls near the top of the quasar Lyα emission and is characterised by a high value of the ELR to continuum flux ratio (x = 2.31). We note that the corresponding W measurement lies well below the curve-of-growth expectation because of partial covering of the ELR. The Fe iλ3441 is characterised by a low x value, and a barely significant shift is seen.
Current usage metrics show cumulative count of Article Views (full-text article views including HTML views, PDF and ePub downloads, according to the available data) and Abstracts Views on Vision4Press platform.
Data correspond to usage on the plateform after 2015. The current usage metrics is available 48-96 hours after online publication and is updated daily on week days.
Initial download of the metrics may take a while.