Fig. 4
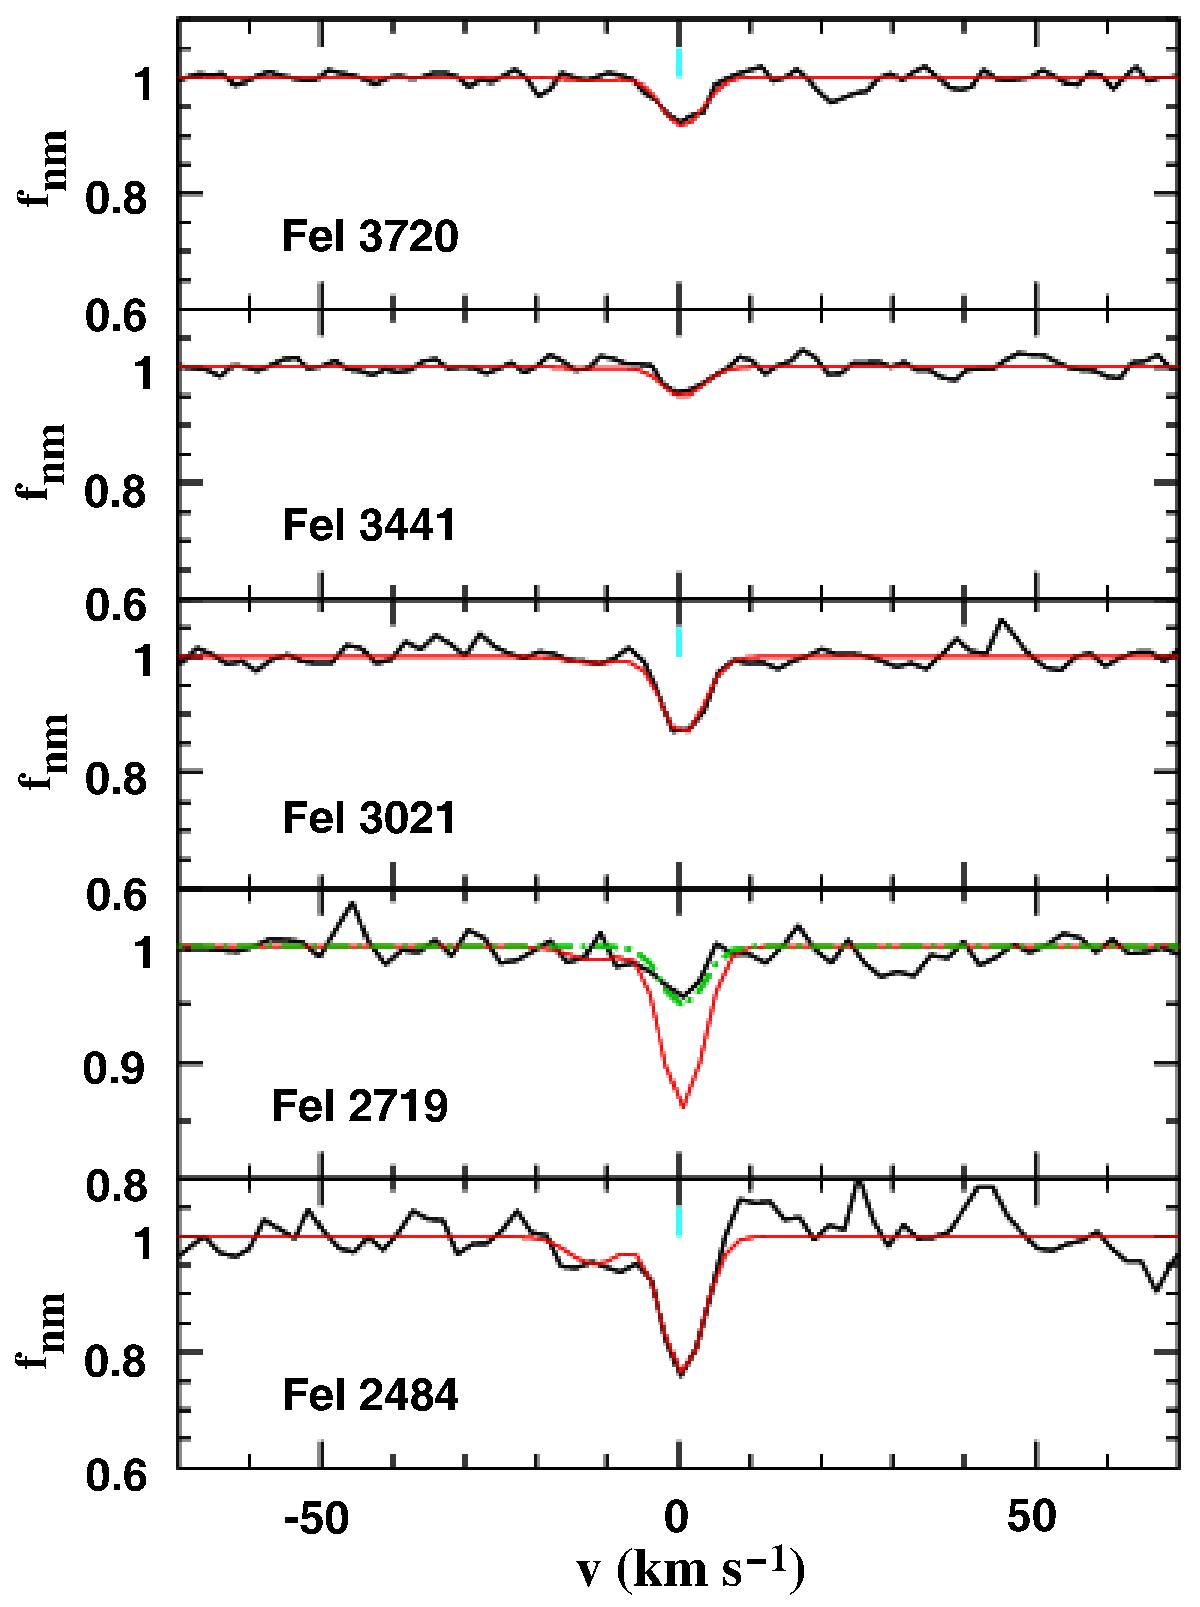
Intervening Fe i absorption towards the quasar HE 0001−2340: UVES 2001 spectrum (black curve) and simultaneous fit for the four transitions falling on the quasar continuum (red curve), thus excluding the Fe iλ2719 line, which falls on the quasar Lyα emission line. The green curve for the Fe iλ2719 absorption corresponds to a fit with a spatial coverage factor Cf,max = 0.37. At vhelio = 0 km s-1, the redshift is z = 0.452060.
Current usage metrics show cumulative count of Article Views (full-text article views including HTML views, PDF and ePub downloads, according to the available data) and Abstracts Views on Vision4Press platform.
Data correspond to usage on the plateform after 2015. The current usage metrics is available 48-96 hours after online publication and is updated daily on week days.
Initial download of the metrics may take a while.