Fig. 13
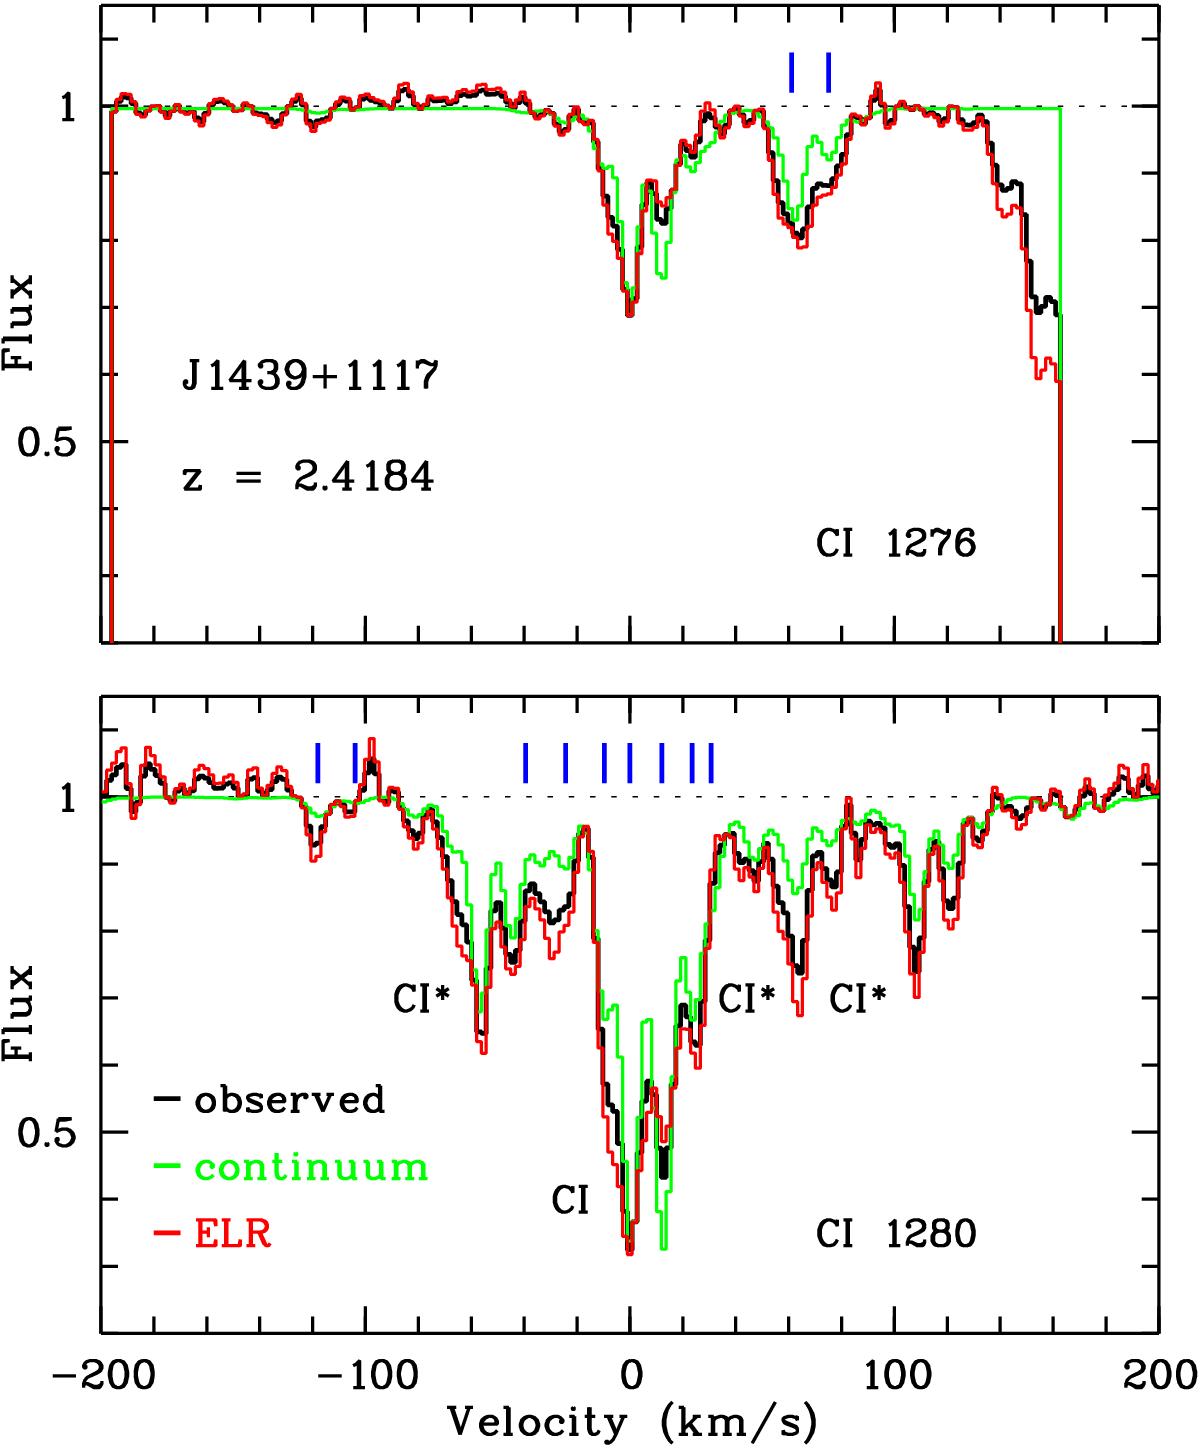
Normalized profile of the C i, C i⋆, and C i⋆⋆ lines near 1276 (top panel) and 1280 Å (bottom) at zabs ≃ 2.418 towards J1439+1117, seen on the Lyα emission line of this quasar. Observed profiles are shown in black, while the profiles derived from fitting of the 1560 and 1656 Å transitions observed against the continuum source are displayed in green and the profiles computed towards the ELR alone (see text) in red. C i⋆ absorption is significantly stronger towards the ELR for the three central components (at v = −10,0 and + 12 km s-1) as well as the C i absorption in the v = −10 km s-1 component. The velocity scale is the same as in Fig. 12.
Current usage metrics show cumulative count of Article Views (full-text article views including HTML views, PDF and ePub downloads, according to the available data) and Abstracts Views on Vision4Press platform.
Data correspond to usage on the plateform after 2015. The current usage metrics is available 48-96 hours after online publication and is updated daily on week days.
Initial download of the metrics may take a while.