Fig. 12
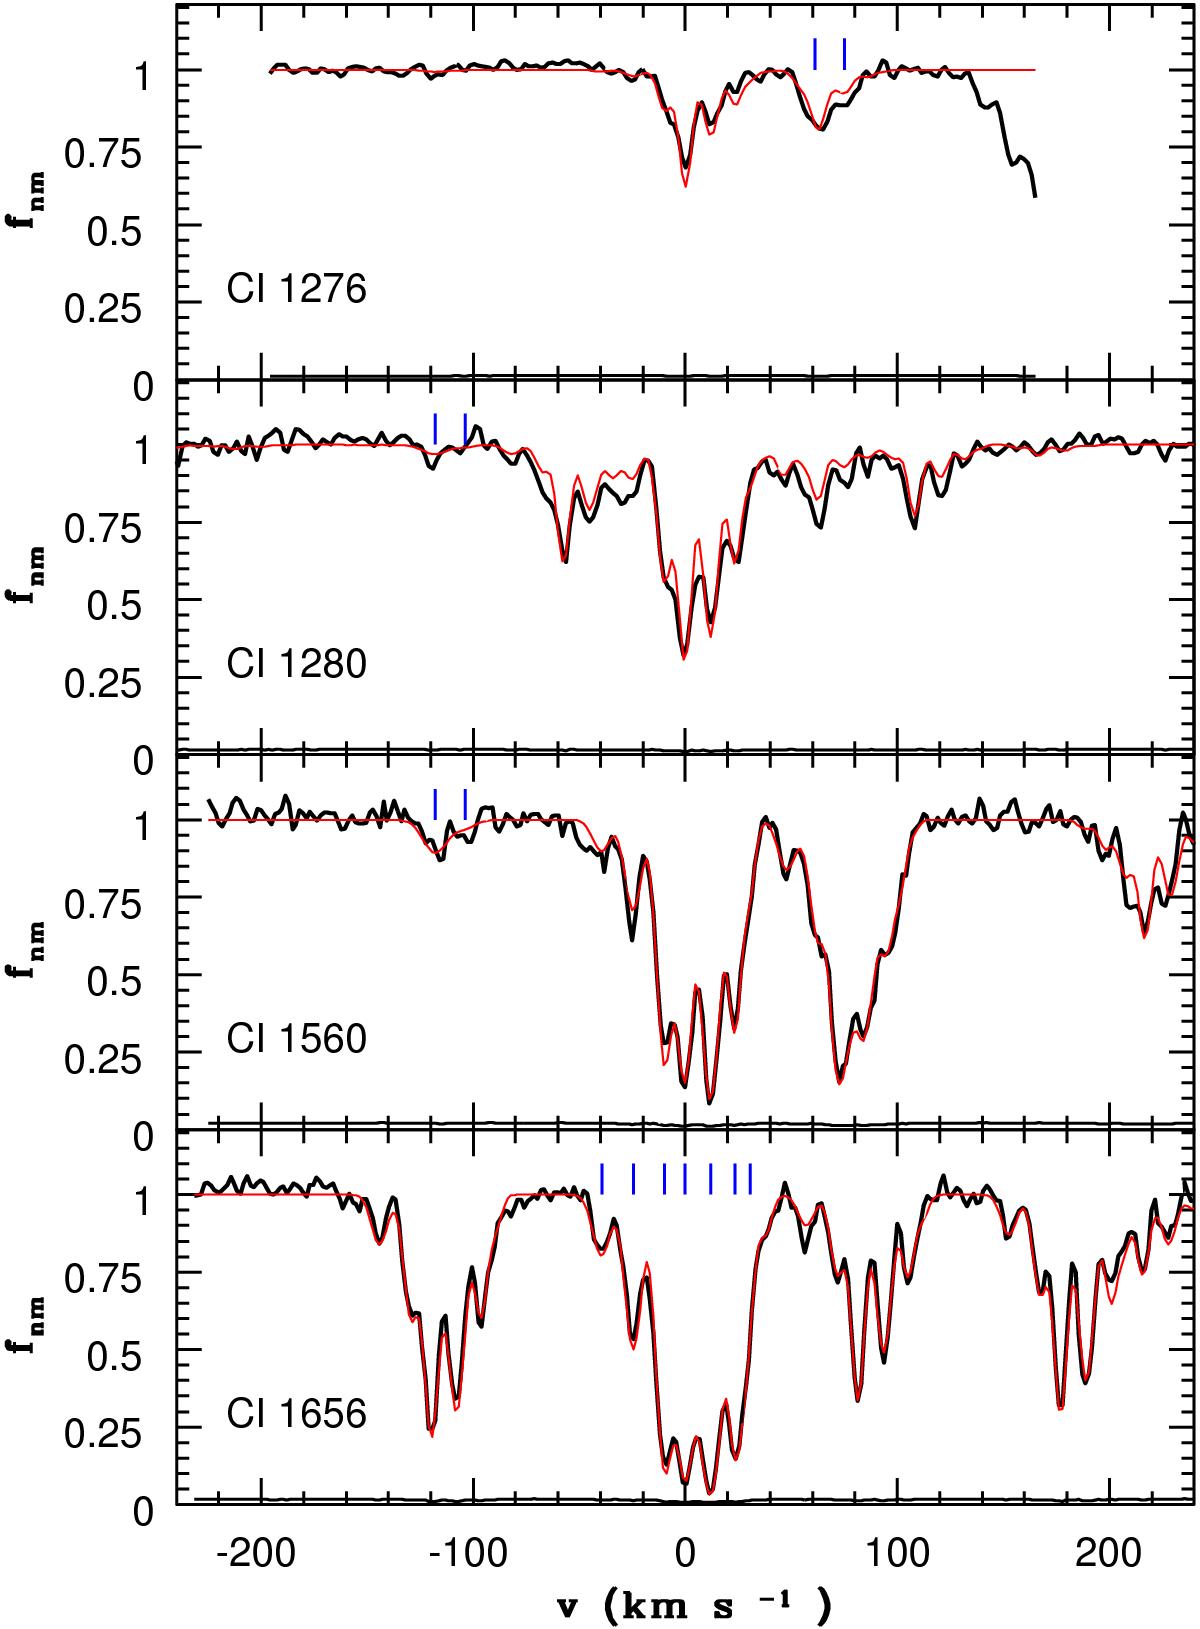
Intervening C i absorption towards the quasar J1439+1117: spectrum (black curve) and simultaneous fit to the four transitions (red curve). The bottom black curve in each panel corresponds to the low noise level (rms ≃ 1.7%). At vhelio = 0 km s-1, the redshift is z = 2.418372: the corresponding C i component has the highest column density. The blue tick marks in the C iλ1656 panel (lower one) correspond to the stronger seven components. In the C iλ1560 panel, the two tick marks correspond to weaker components at −104 and −118 km s-1. In the upper panel, the absorption seen in the 50–90 km s-1 velocity range is a blend of C i⋆λ1276 and C iλ1277 from the two weak components with the bluest velocity.
Current usage metrics show cumulative count of Article Views (full-text article views including HTML views, PDF and ePub downloads, according to the available data) and Abstracts Views on Vision4Press platform.
Data correspond to usage on the plateform after 2015. The current usage metrics is available 48-96 hours after online publication and is updated daily on week days.
Initial download of the metrics may take a while.