Fig. 5
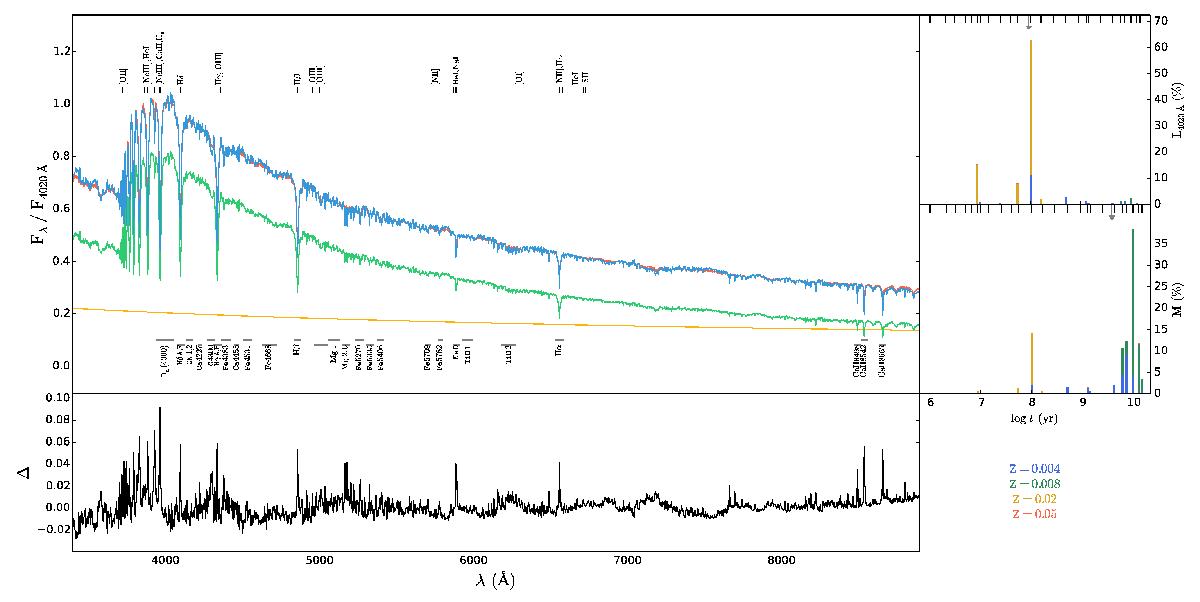
Mean results of 10 Starlight fits to a SED with a CSP with 100 Myr, solar metallicity, and an instantaneous burst SFH (green line) and an AGN PL with α = 1.5 and xAGN = 0.2 (yellow line). Main panel: The red and cyan lines correspond to the input and and fitted spectra, respectively. The top and bottom annotations represent the wavelength range of several emission and absorption lines, respectively. Bottom panel: residuals spectrum (black line) after subtracting the best fit from the input SED is shown. Top right panel: SFHs in stellar light fractions is shown. Different colours correspond to different metallicities (see text below x-axis for label details). Lines on the top x-axis denote the age of the adopted base of SSPs. Bottom right panel: SFHs in mass fractions are shown.
Current usage metrics show cumulative count of Article Views (full-text article views including HTML views, PDF and ePub downloads, according to the available data) and Abstracts Views on Vision4Press platform.
Data correspond to usage on the plateform after 2015. The current usage metrics is available 48-96 hours after online publication and is updated daily on week days.
Initial download of the metrics may take a while.