Fig. A.1
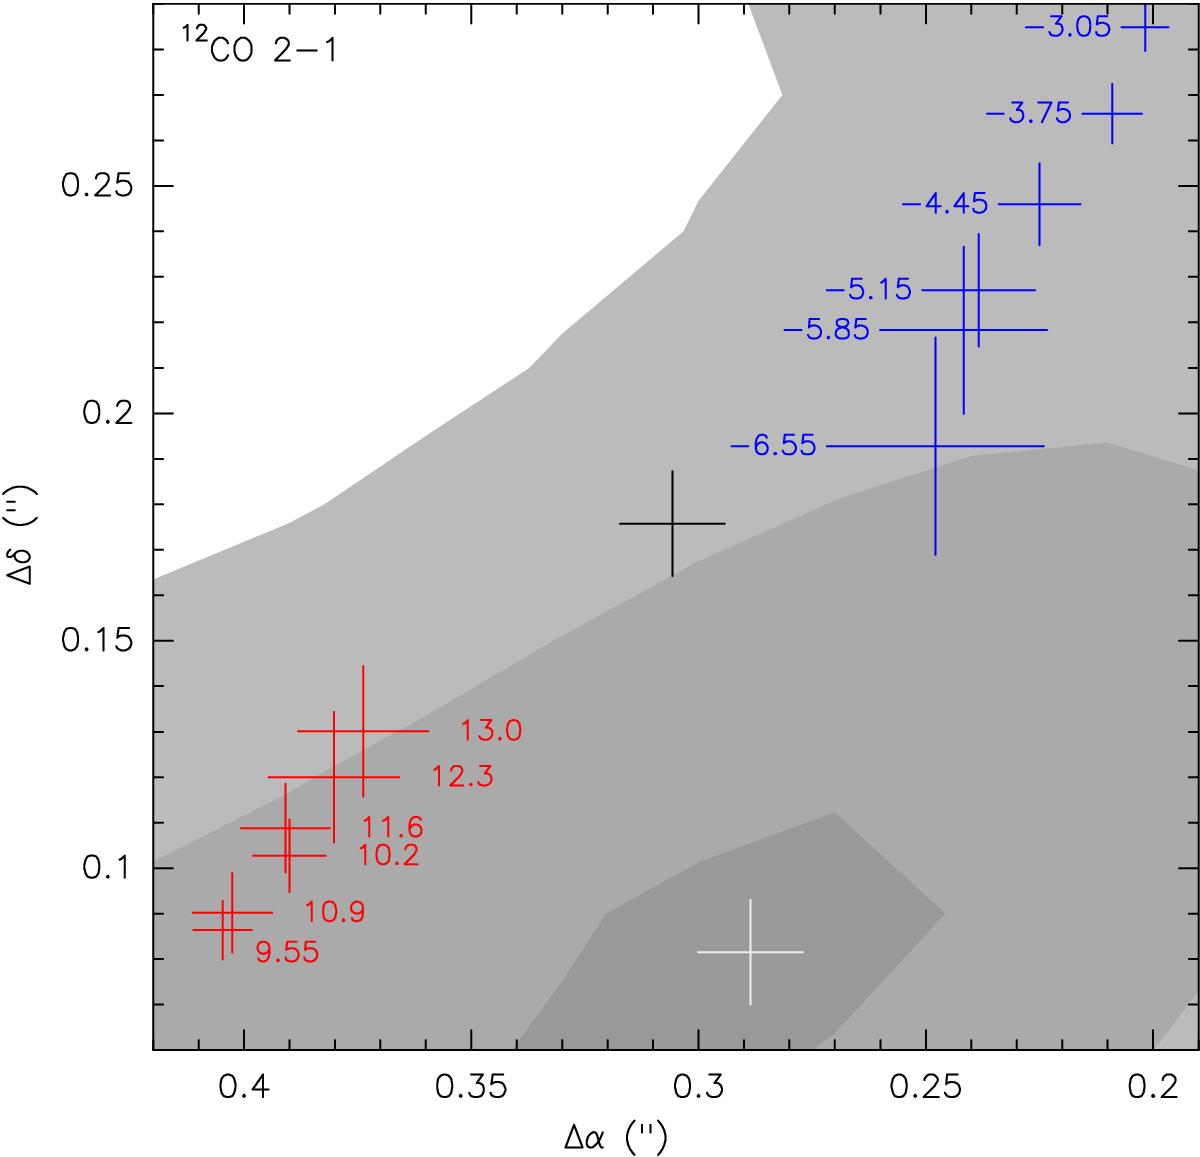
Zoomed-in view of the disk center. The gray scale is the dust continuum emission. The color crosses are the peak of CO emission at high-velocity channels. The length of the cross indicates the uncertainty of the peak position. The numbers next to the crosses indicate the corresponding velocity channel (in km s-1). The black cross is the averaged center position for the high-velocity channels, and the white cross shows the dust emission peak.
Current usage metrics show cumulative count of Article Views (full-text article views including HTML views, PDF and ePub downloads, according to the available data) and Abstracts Views on Vision4Press platform.
Data correspond to usage on the plateform after 2015. The current usage metrics is available 48-96 hours after online publication and is updated daily on week days.
Initial download of the metrics may take a while.