Fig. 3
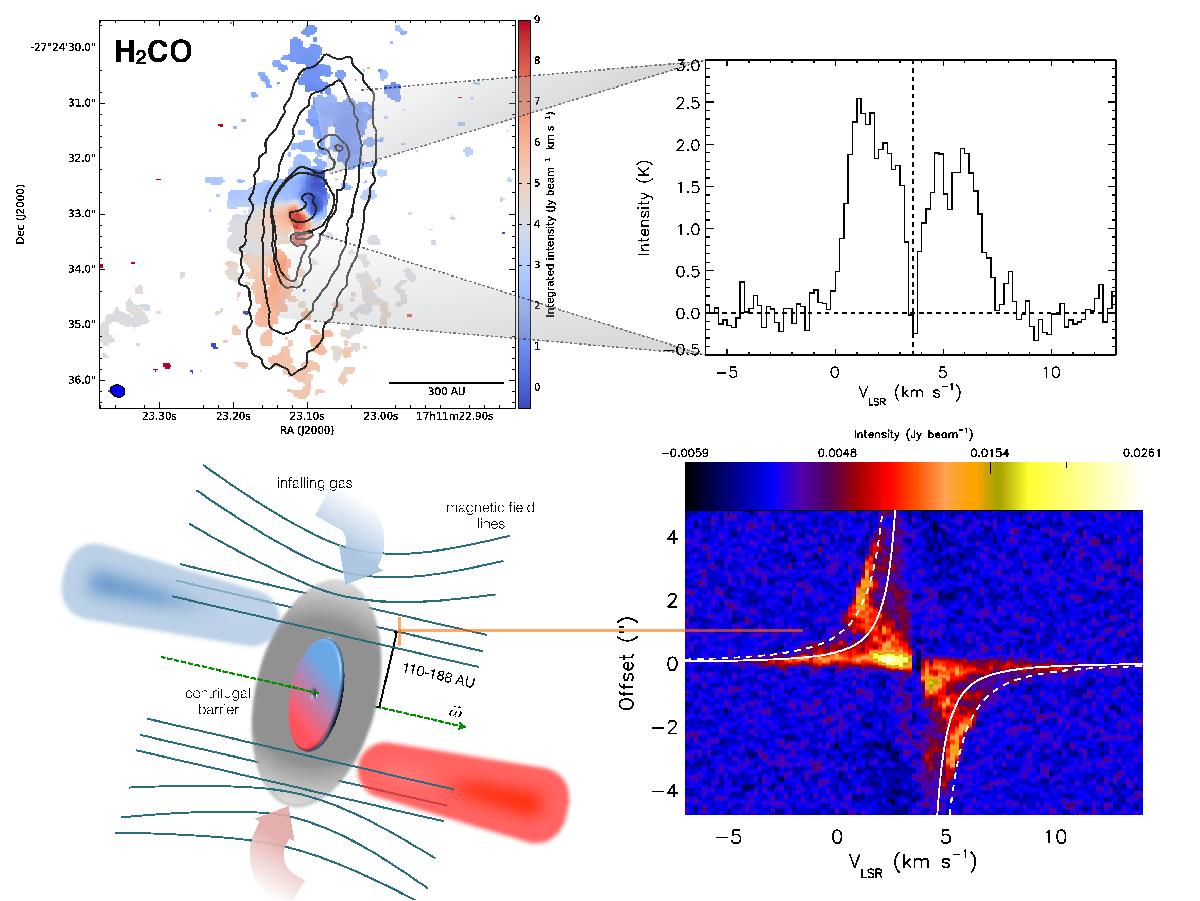
Upper panel: velocity field of the H2CO emission with respect to the continuum emission (contours). The inset shows an asymmetric line profile taken from a radius between 120 and 435 AU where the blueshifted emission is brighter than the redshifted one, which is typical of infall motions. The thick vertical dashed line shows the ambient velocity according to previous observations (Vlsr ~3.6 km s-1, Onishi et al. 1999; Hara et al. 2013). The horizontal dashed line shows the continuum-removed zero-level baseline. Lower panels: scheme showing outflows powered at the disk edge that are due to the magnetic field enhancement. The right panel shows the PV diagram of the H2CO emission with the same Keplerian curves as in Fig. 2. The discontinuity in the velocity distribution pattern around ~![]() indicates the change in kinematics probably caused by the centrifugal barrier. The discontinuity is preceded by a velocity peak (better seen in the northern lobe as a “knee” in the PV plot) and followed by a sharp increase in radial velocity in the inner 0.6′′ as a result of the disk rotation.
indicates the change in kinematics probably caused by the centrifugal barrier. The discontinuity is preceded by a velocity peak (better seen in the northern lobe as a “knee” in the PV plot) and followed by a sharp increase in radial velocity in the inner 0.6′′ as a result of the disk rotation.
Current usage metrics show cumulative count of Article Views (full-text article views including HTML views, PDF and ePub downloads, according to the available data) and Abstracts Views on Vision4Press platform.
Data correspond to usage on the plateform after 2015. The current usage metrics is available 48-96 hours after online publication and is updated daily on week days.
Initial download of the metrics may take a while.