Fig. 2
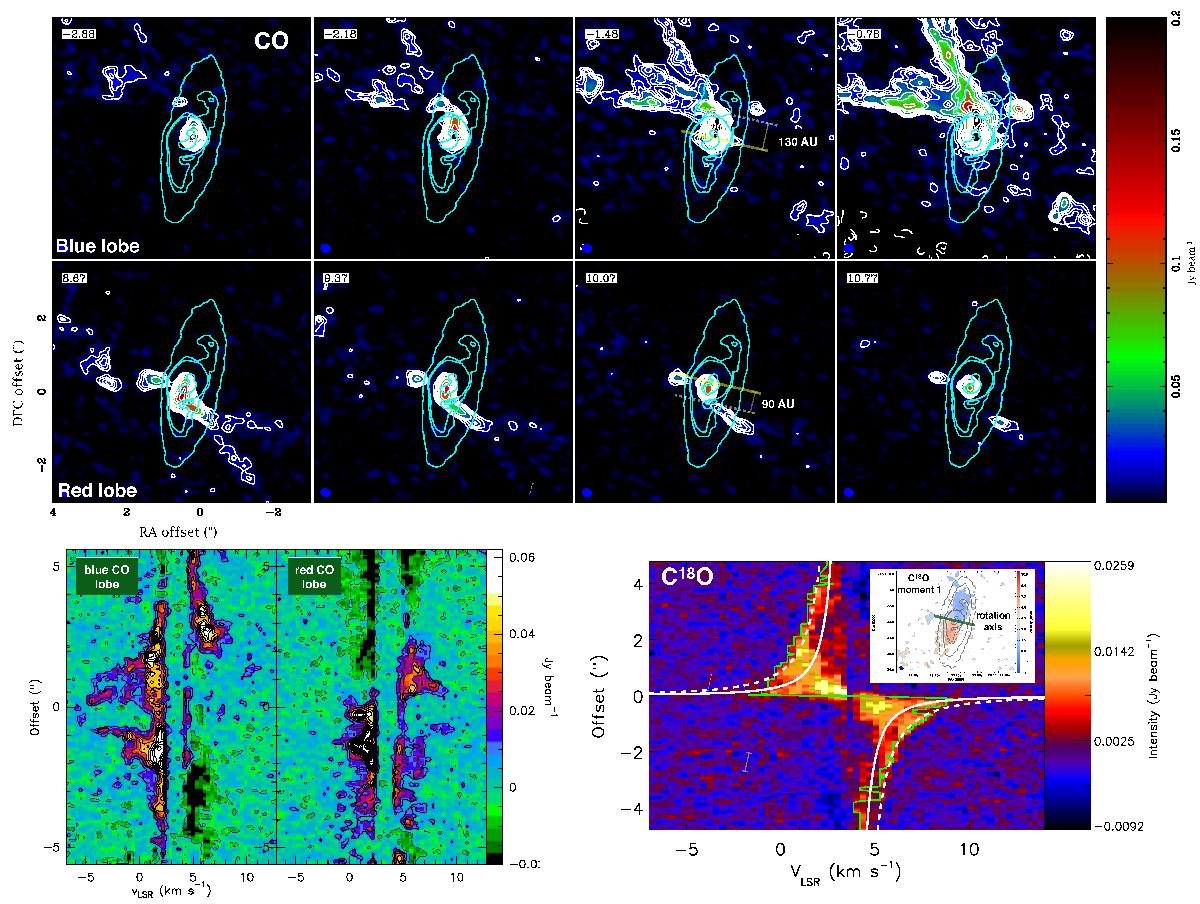
Upper panel: CO (2–1) channel map with color-filled contours at 4, 6, 8, 10... 90σ (1σ = 4 mJy beam-1) overplotted on the dust emission (cyan contours with the same intensity levels as Fig. 1). The velocity channels are labeled in the upper left corner of each panel. The channel spacing is binned to 0.7 km s-1 . The yellow arrow line in channels −1.48 km s-1 and 10.07 km s-1 indicates the rotation axis of the disk. Lower left panel: PV plots taken from cuts transversal to the outflow axis in each lobe. The cavity pattern is indicated by the large opening angle. Lower right panel: C18O PV diagram from a cut along the source long axis. The dashed line shows the best Keplerian fit to the 3σ envelope (green line), following the method proposed by Seifried et al. (2016). The fit corresponds to a dynamical mass of 1.70 ± 0.04M⊙ , while the white line shows the fit of Hara et al. (2013) for a mass of 0.73 M⊙ . The inset shows the C18O velocity field for a pixel intensity brighter than 50% of the peak flux (25 mJy beam-1). The contours refer to the continuum emission, and the green arrow shows the rotation axis. The synthesized beam is ![]() for the continuum,
for the continuum, ![]() for the CO data, and
for the CO data, and ![]() for the C18O data.
for the C18O data.
Current usage metrics show cumulative count of Article Views (full-text article views including HTML views, PDF and ePub downloads, according to the available data) and Abstracts Views on Vision4Press platform.
Data correspond to usage on the plateform after 2015. The current usage metrics is available 48-96 hours after online publication and is updated daily on week days.
Initial download of the metrics may take a while.