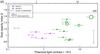
Fig. 5
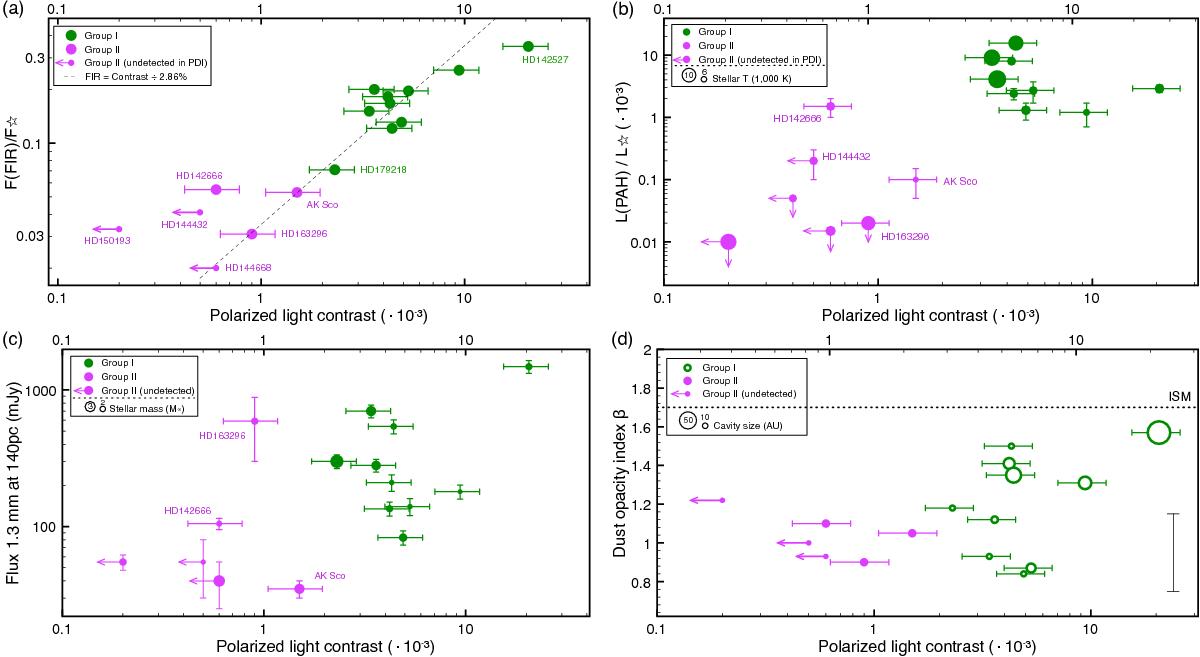
Outer disk properties of the sample compared with the contrast. a) Far-IR excess normalized to the stellar flux. b) PAH luminosity normalized to the stellar flux. The symbol size reflects the stellar temperature with dynamic range between 10 470 K and 6450 K. c) Flux at 1.3 mm normalized at a distance of 140 pc. The error on the y-axis reflects the uncertainty on the distance (typically smaller for Gaia measurements). The symbol size reflects the stellar mass with dynamic range between 1.6 M⊙ and 3.2 M⊙. d) Dust opacity index βmm. The symbol size reflects the cavity size from the PDI images. Typical errors for this source type are indicated by the vertical bar to the right.
Current usage metrics show cumulative count of Article Views (full-text article views including HTML views, PDF and ePub downloads, according to the available data) and Abstracts Views on Vision4Press platform.
Data correspond to usage on the plateform after 2015. The current usage metrics is available 48-96 hours after online publication and is updated daily on week days.
Initial download of the metrics may take a while.