Fig. 4
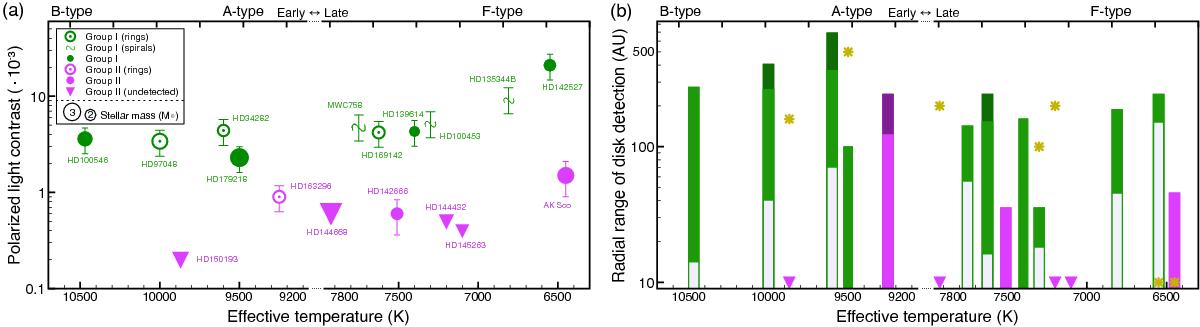
Disk properties compared to stellar properties. a) Polarized-to-stellar light contrast compared to the stellar effective temperature. Note the discontinuity on the x-axis. The symbol size indicates the stellar mass with dynamic range between 1.6 M⊙ and 3.2 M⊙. b) Radial range of detection in PDI, compared to the stellar effective temperature. When continuum millimeter imaging reveals a larger radius, this is indicated by the darker areas at the top of the bars. The white areas indicate disk cavities. The yellow symbols give the projected distance of the companions. When these symbols are at the base of the bars, they indicate a binary system surrounded by the disk.
Current usage metrics show cumulative count of Article Views (full-text article views including HTML views, PDF and ePub downloads, according to the available data) and Abstracts Views on Vision4Press platform.
Data correspond to usage on the plateform after 2015. The current usage metrics is available 48-96 hours after online publication and is updated daily on week days.
Initial download of the metrics may take a while.