Fig. 3
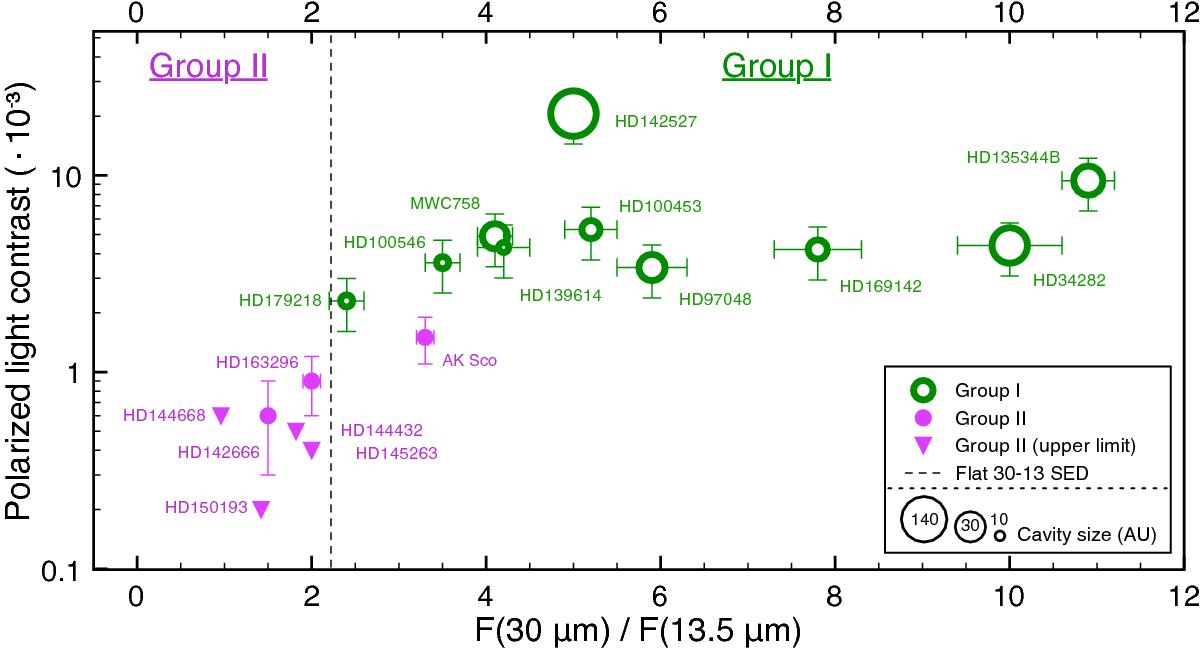
Polarized-to-stellar light contrast for all the sources in the sample (see Appendix A) compared with the flux ratio at 30 μm and 13.5 μm. GI disks are plotted in green, GII in purple. The disk cavity, where known and as taken from different datasets (see text), is indicated by a gap in the symbol, proportional to the cavity size with dynamic range from 5 AU to 140 AU. The dashed line indicates the ratio corresponding to a flat SED, obtained from 30 ÷ 13.5 = 2.2. The ratios are from Acke et al. (2010), while the contrasts are from this work, as explained in Appendix B.
Current usage metrics show cumulative count of Article Views (full-text article views including HTML views, PDF and ePub downloads, according to the available data) and Abstracts Views on Vision4Press platform.
Data correspond to usage on the plateform after 2015. The current usage metrics is available 48-96 hours after online publication and is updated daily on week days.
Initial download of the metrics may take a while.