Fig. 3
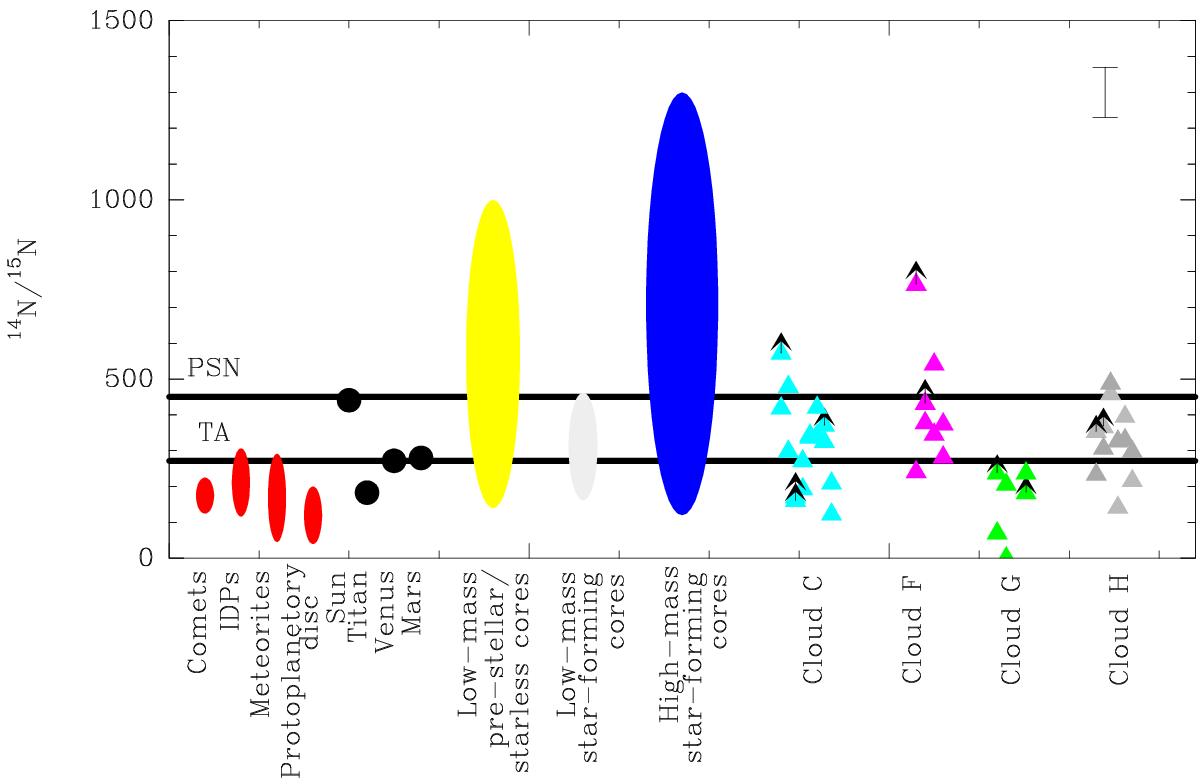
Nitrogen isotope ratio variations measured in different sources starting from small solar system bodies (in red; Busemann et al. 2006; Floss et al. 2006; Alexander et al. 2007; Bockelée-Morvan et al. 2008; Manfroid et al. 2009; Mumma & Charnley 2011; Guzmán et al. 2017) to planets (in black; Junk & Svec 1958; Hoffman et al. 1979; Fouchet et al. 2004; Niemann et al. 2005; Marty et al. 2010; Wong et al. 2013; Fletcher et al. 2014), low-mass prestellar cores (in yellow; Gerin et al. 2009; Bizzocchi et al. 2010; Lis et al. 2010; Bizzocchi et al. 2013; Hily-Blant et al. 2013), low-mass star-forming cores (in light grey; Wampfler et al. 2014) and high-mass star-forming cores (in blue; Adande & Ziurys 2012; Fontani et al. 2015). Our measurements in IRDCs are shown on the right. On the upper right corner, we show a representative error bar for our measurements of the 14N/15N ratio. Black arrows indicate the lower limits in our measurements. The 14N/15N ratio measured in HCN from core G2 is shown as zero with no lower limit indication owing to both of the column densities of H13CN and HC15N are only given as upper limits.
Current usage metrics show cumulative count of Article Views (full-text article views including HTML views, PDF and ePub downloads, according to the available data) and Abstracts Views on Vision4Press platform.
Data correspond to usage on the plateform after 2015. The current usage metrics is available 48-96 hours after online publication and is updated daily on week days.
Initial download of the metrics may take a while.