Fig. 13
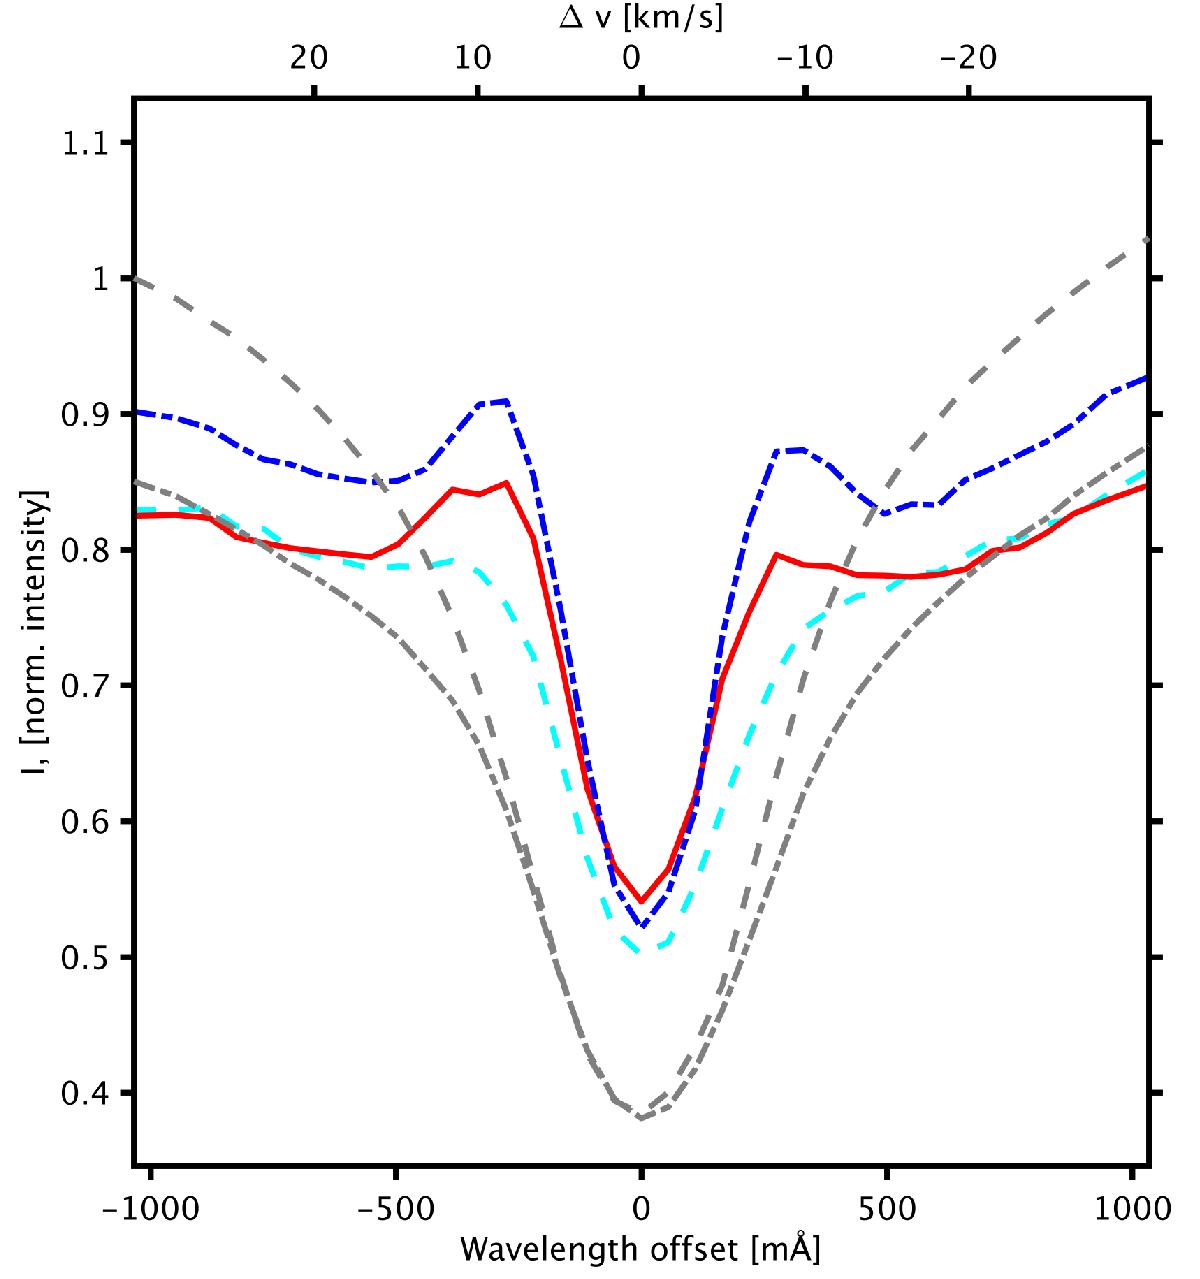
Ca ii 8542 Å line profiles normalized to the average quiet-Sun line profile at different positions within a PMJ event detection area. The corresponding positions and the detection border of the event are marked in Fig. 4. Three specific PMJ line profiles are shown, one situated closest to the umbra (dashed-turquoise, turquoise cross in Fig. 4), the center-of-mass pixel position (solid-red, red ×-mark in Fig. 4) and one situated furthest from the umbra (dotted-dashed-blue, blue star in Fig. 4). Reference averages of the Ca ii 8542 Å line profile over the whole time series are given for the upper left corner of the full-FOV (grey-dashed) and the penumbra (grey-dot-dashed) (see Fig. 1 for outlines of both areas).
Current usage metrics show cumulative count of Article Views (full-text article views including HTML views, PDF and ePub downloads, according to the available data) and Abstracts Views on Vision4Press platform.
Data correspond to usage on the plateform after 2015. The current usage metrics is available 48-96 hours after online publication and is updated daily on week days.
Initial download of the metrics may take a while.