Fig. 12
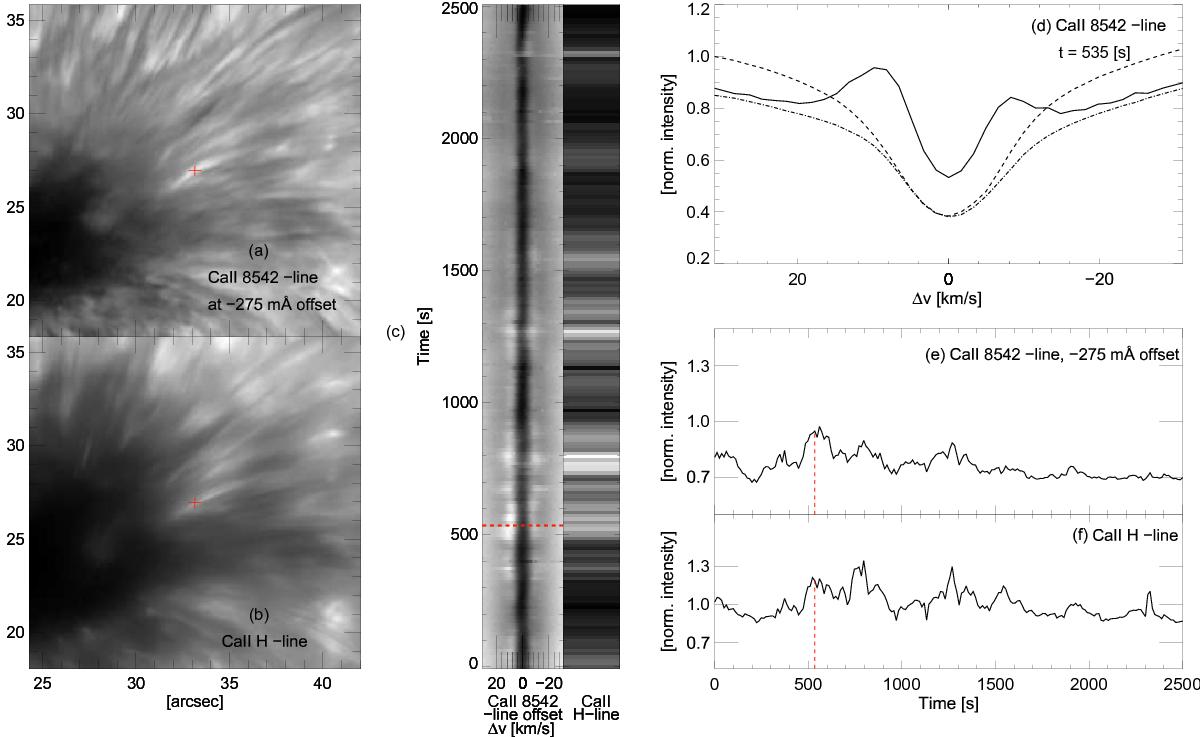
PMJ event studied in detail at time = 535 s. a) PMJ marked by a cross in a subfield of the observations in the Ca ii 8542 Å line at an offset of − 275 mÅ. b) PMJ marked by a cross in a subfield of the observations in the Ca ii H line. c) Timeslices for the full duration of the observations in the sampled Ca ii 8542 Å line (left) with time of the event indicated (dashed), and in the monochromatic Ca ii H line core (right). d) Ca ii 8542 Å line profile of the PMJ event (solid) with the average of the line over the upper left section of the full FOV (dashed) and the average of the line over the penumbra, umbra excluded (dashed-dotted) (see Fig. 1 for these regions), with time of the event given. e) Intensity curve in the Ca ii 8542 Å line (solid) at an offset of − 275 mÅ for the full duration of the observation at the PMJ event location with PMJ event time (dashed). f) Intensity curve in the same position and duration in the Ca ii H line core (solid) and event time (dashed).
Current usage metrics show cumulative count of Article Views (full-text article views including HTML views, PDF and ePub downloads, according to the available data) and Abstracts Views on Vision4Press platform.
Data correspond to usage on the plateform after 2015. The current usage metrics is available 48-96 hours after online publication and is updated daily on week days.
Initial download of the metrics may take a while.