Fig. 8
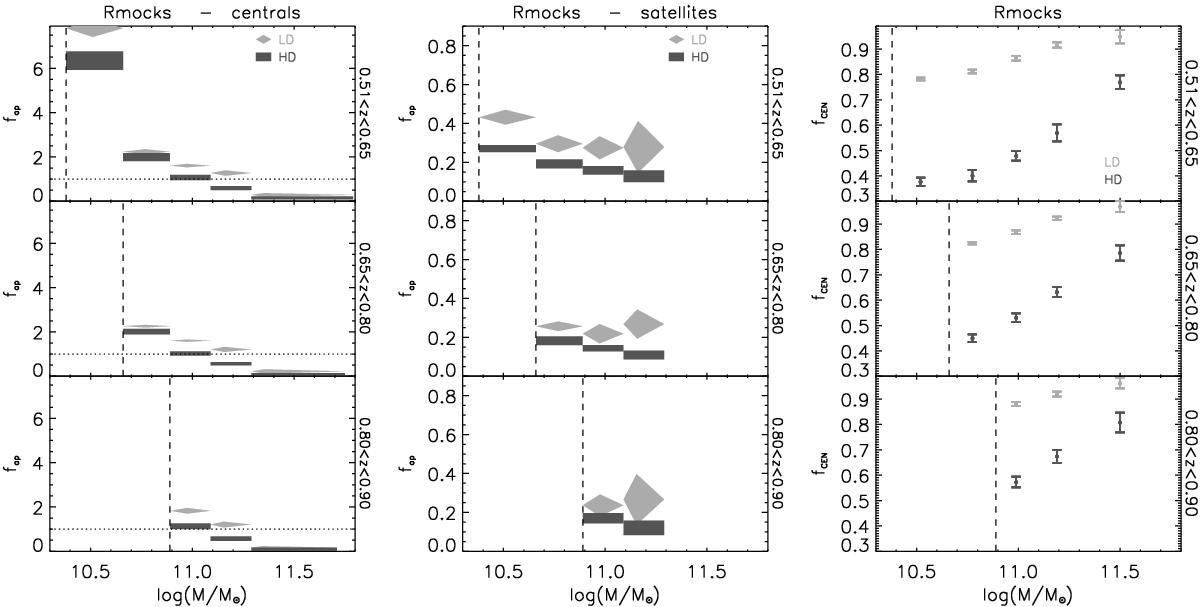
Left: fraction fap in the Rmocks (similar to the filled symbols in Fig. 6), but considering only central galaxies. Middle: as in the left panel, but considering only satellite galaxies. Note the different y-axis ranges in the left and middle panels. We plot fap only in the mass bins where there are at least 20 galaxies per light cone. Right: fraction of central galaxies in the Rmocks in the same redshift ranges and stellar mass bins as in the left and middle panels. The fraction is the mean value of the 16 Rmocks and the vertical error bar is the rms around the mean. The fraction refers to the total number of galaxies, regardless of whether they are classified passive, intermediate, or active
Current usage metrics show cumulative count of Article Views (full-text article views including HTML views, PDF and ePub downloads, according to the available data) and Abstracts Views on Vision4Press platform.
Data correspond to usage on the plateform after 2015. The current usage metrics is available 48-96 hours after online publication and is updated daily on week days.
Initial download of the metrics may take a while.