Fig. 3
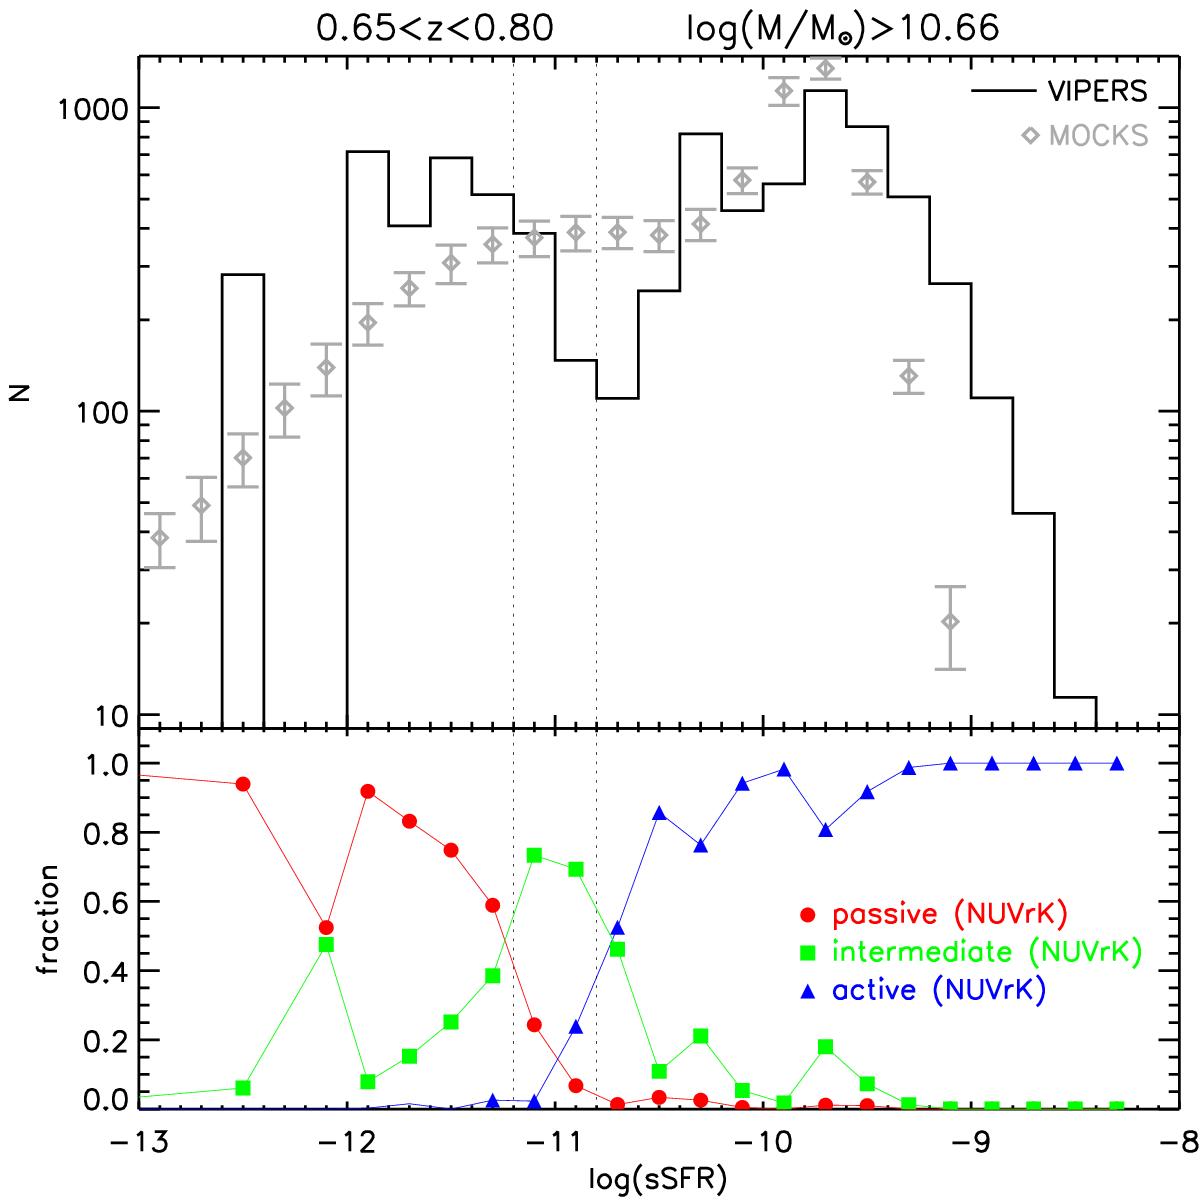
Top: black histogram: distribution of the sSFR (=SFR/ ℳ) for the VIPERS galaxies in the redshift range 0.65 <z< 0.8 and for log (ℳlim/ ℳ⊙) > 10.66, which is the completeness mass limit in that redshift range. Diamonds: sSFR distribution in the Rmocks for galaxies in the same redshift range and above the same mass threshold; the points with the vertical error bars correspond to the average and rms of the 50 mocks catalogues. The sSFR distribution of the Rmocks is normalised to have the same total number of galaxies as in the VIPERS sSFR distribution. Both the real and simulated distributions have a tail of galaxies with sSFR values below the lowest sSFR limit in this plot, which we do not plot for the sake of clarity. Bottom: only for the VIPERS sample (same galaxies as in the top panel), fraction of passive (red circles) and active (blue triangles) galaxies as defined by Eqs. (3) and (4), as a function of their sSFR. We also overplot the fraction of “intermediate” galaxies, i.e. those that do not satisfy the passive or the active definition. The vertical lines at log (sSFR) = −11.2 and log (sSFR) = −10.8 are the thresholds adopted to define passive and active galaxies, respectively, using the sSFR as discussed in Sect. 4.1. These results are very similar in the two other redshift bins (not shown).
Current usage metrics show cumulative count of Article Views (full-text article views including HTML views, PDF and ePub downloads, according to the available data) and Abstracts Views on Vision4Press platform.
Data correspond to usage on the plateform after 2015. The current usage metrics is available 48-96 hours after online publication and is updated daily on week days.
Initial download of the metrics may take a while.