Fig. 2
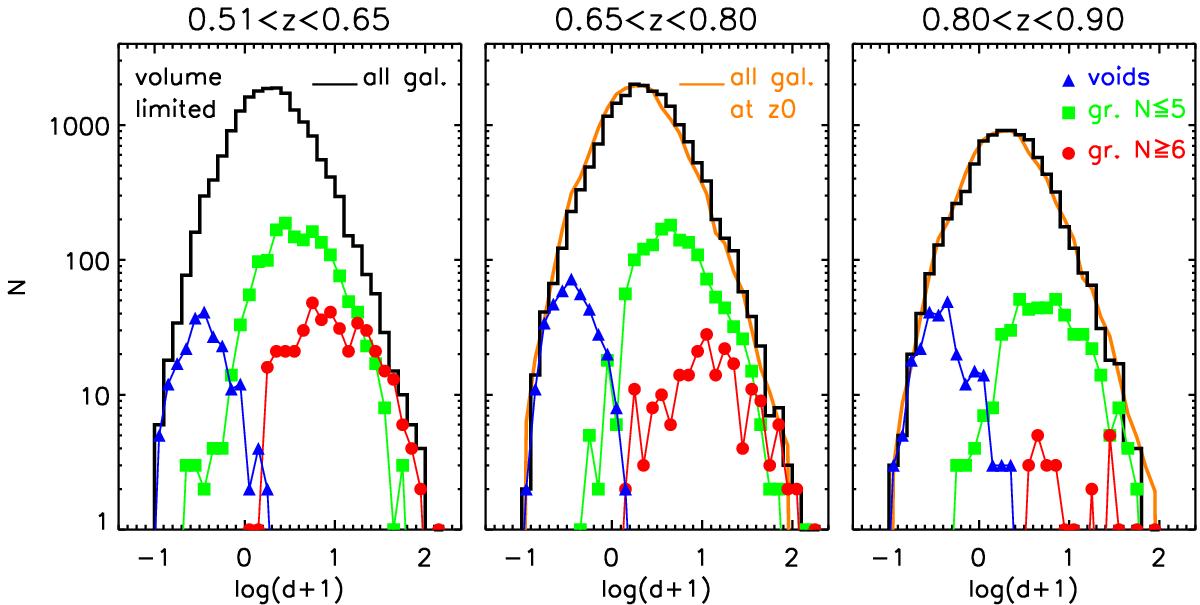
Density distribution of the VIPERS galaxies in three redshift bins (three columns) for the entire sample (black histogram), for galaxies in voids (blue triangles), in groups with at most five members (green squares), and in groups with at least six members (red circles). See the text for the definition of groups and voids. The density field is computed with cylindrical filters, with a radius given by the fifth n.n. using the volume-limited tracers, which are complete up to z = 0.9. To facilitate comparison, in the second and third redshift bins the orange line is the density distribution of the entire sample in the first redshift bin, normalised to the total number of galaxies in each bin.
Current usage metrics show cumulative count of Article Views (full-text article views including HTML views, PDF and ePub downloads, according to the available data) and Abstracts Views on Vision4Press platform.
Data correspond to usage on the plateform after 2015. The current usage metrics is available 48-96 hours after online publication and is updated daily on week days.
Initial download of the metrics may take a while.