Fig. A.2
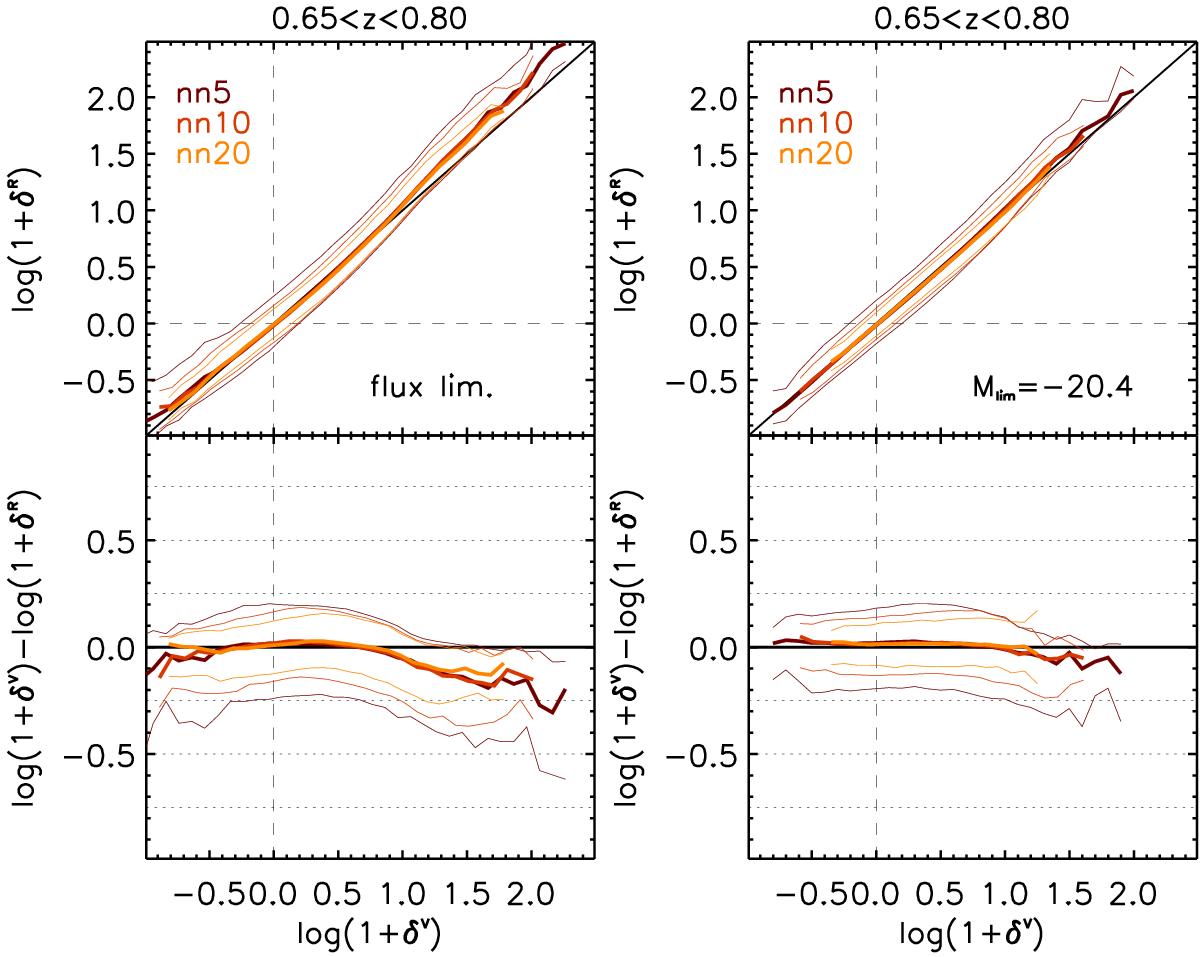
Comparison of δR and δV on a galaxy-by-galaxy basis. Results are shown for the cylindrical filter with radius corresponding to the fifth, tenth, and twentieth n.n. for the redshift bin 0.65 <z< 0.8. The density is computed using flux-limited tracers (left) and volume-limited tracers with Mlim = −20.4 (right). x-axis: density contrast in the Vmocks; y-axis, top panel: density contrast in the Rmocks; y-axis, bottom panel: difference of the logarithms. The thick lines are the median value of the quantity displayed on the y-axis in each x-axis bin. Thin lines represent the sixteenth and eightyfourth percentiles of its distribution. The solid black line in the top panels is the one-to-one line, and the horizontal lines in the bottom panels are for reference.
Current usage metrics show cumulative count of Article Views (full-text article views including HTML views, PDF and ePub downloads, according to the available data) and Abstracts Views on Vision4Press platform.
Data correspond to usage on the plateform after 2015. The current usage metrics is available 48-96 hours after online publication and is updated daily on week days.
Initial download of the metrics may take a while.