Fig. A.1
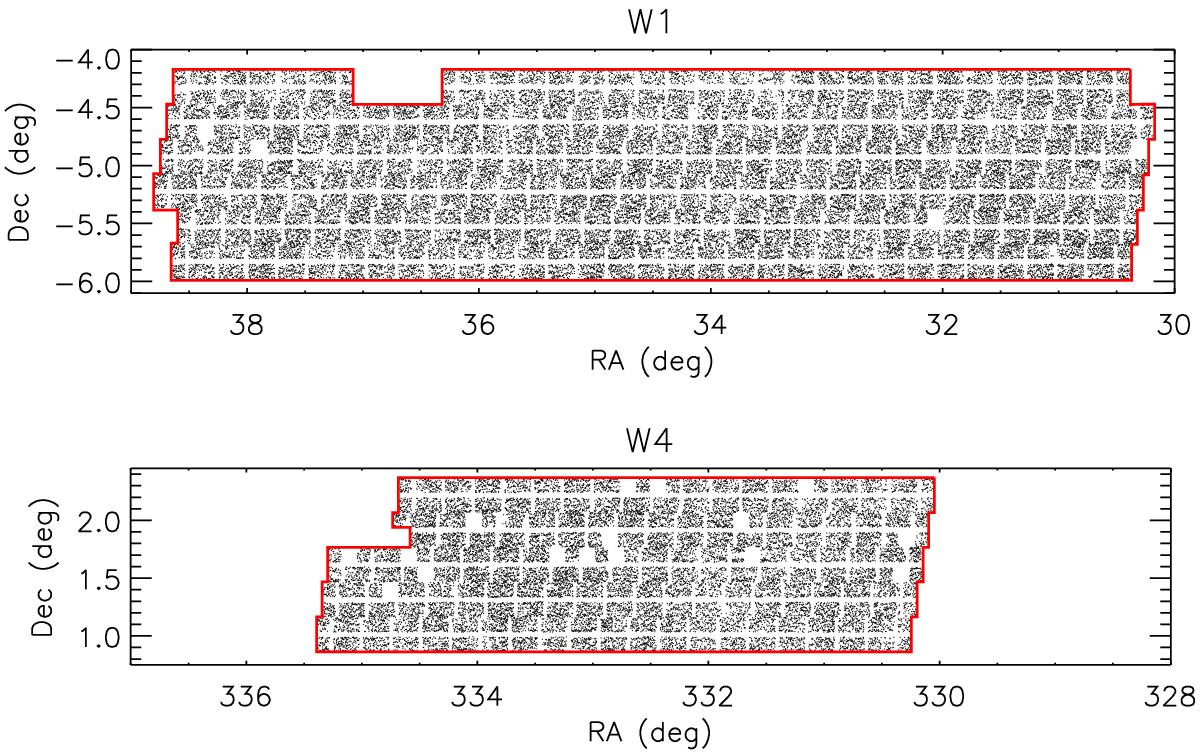
RA-Dec distribution of secure redshift galaxies in W1 (top) and W4 (below). The red thick line in each panel is the “field boundary” that we consider in this work. The cross-like pattern of void regions is due to the characteristic footprint of the VIMOS instrument. Rectangular empty regions are missing quadrants that have been discarded due to too poor observational conditions or technical problems.
Current usage metrics show cumulative count of Article Views (full-text article views including HTML views, PDF and ePub downloads, according to the available data) and Abstracts Views on Vision4Press platform.
Data correspond to usage on the plateform after 2015. The current usage metrics is available 48-96 hours after online publication and is updated daily on week days.
Initial download of the metrics may take a while.