Fig. 1
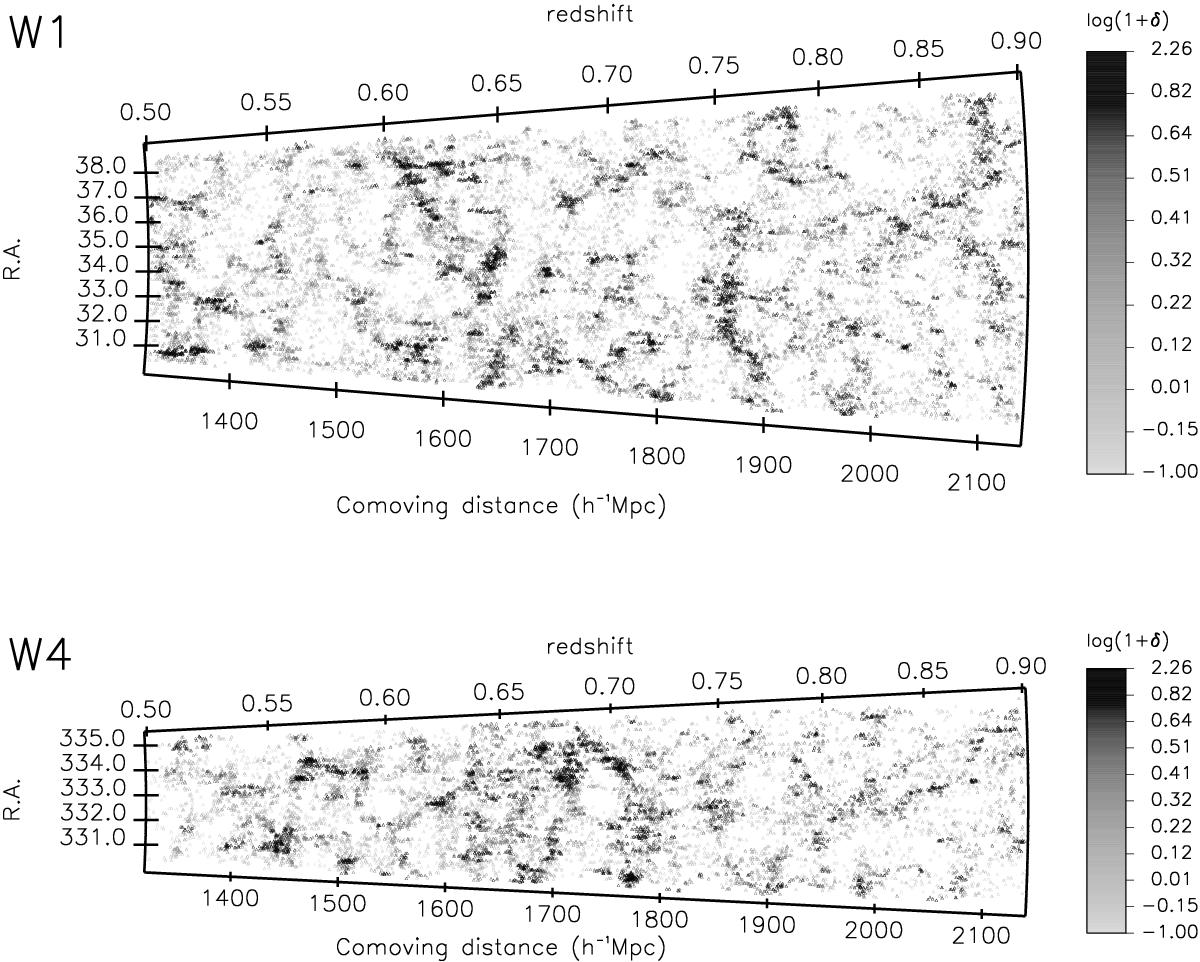
RA−z distribution of secure-redshift galaxies in W1 (top) and W4 (below), in comoving coordinates. For the sake of clarity, only the central degree in Dec is plotted. The colour used for each galaxy refers to the value of the local density computed around the galaxy (from light grey for the lowest density to black for the highest density, as in the colour bar). The density is computed in cylindrical filters with radius corresponding to the fifth n.n., using the volume-limited sample of tracers that is complete up to z = 0.9.
Current usage metrics show cumulative count of Article Views (full-text article views including HTML views, PDF and ePub downloads, according to the available data) and Abstracts Views on Vision4Press platform.
Data correspond to usage on the plateform after 2015. The current usage metrics is available 48-96 hours after online publication and is updated daily on week days.
Initial download of the metrics may take a while.