Free Access
Fig. 4
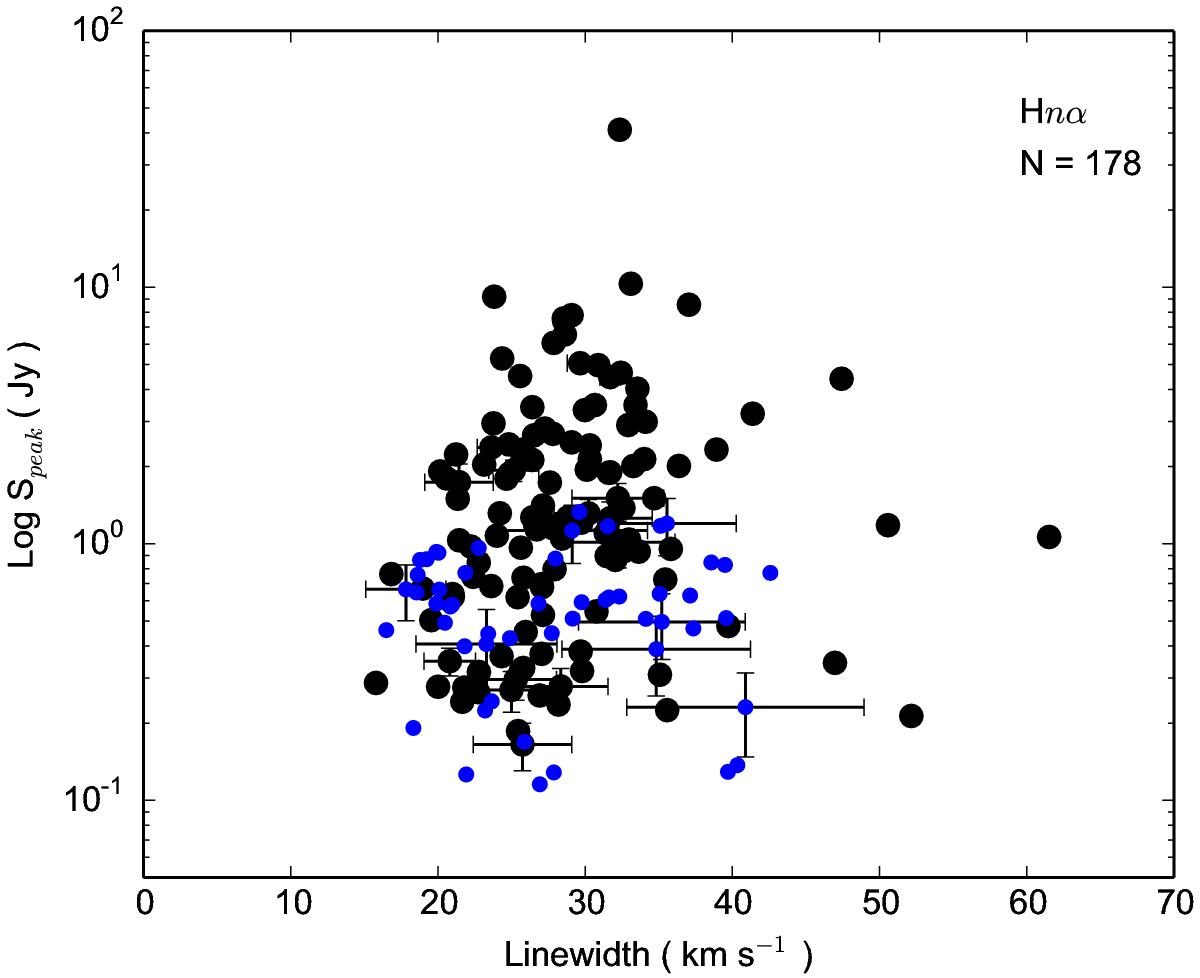
Distribution of Hnα RRLs peak intensity as a function of linewidth. The blue dots indicate sources with mm-RRLs detected below 5σ. The error bars are plotted for every 7th source chosen at random to show their range.
Current usage metrics show cumulative count of Article Views (full-text article views including HTML views, PDF and ePub downloads, according to the available data) and Abstracts Views on Vision4Press platform.
Data correspond to usage on the plateform after 2015. The current usage metrics is available 48-96 hours after online publication and is updated daily on week days.
Initial download of the metrics may take a while.