Free Access
Fig. A.1
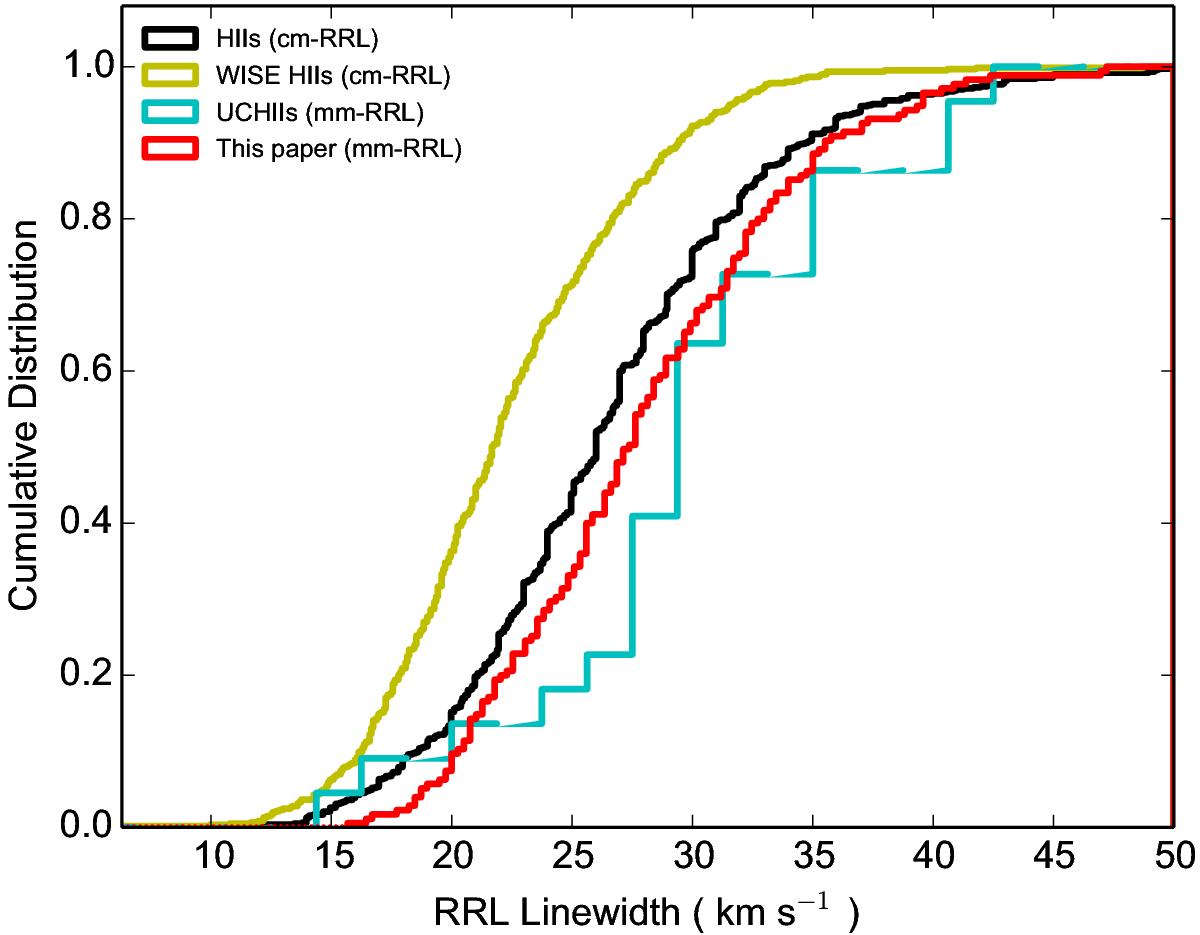
Cumulative distributions of RRL linewidths for this paper (red line) and previous surveys (yellow line: Anderson et al. 2011; black line: Lockman 1989; Caswell & Haynes 1987; and cyan line: Churchwell et al. 2010).
Current usage metrics show cumulative count of Article Views (full-text article views including HTML views, PDF and ePub downloads, according to the available data) and Abstracts Views on Vision4Press platform.
Data correspond to usage on the plateform after 2015. The current usage metrics is available 48-96 hours after online publication and is updated daily on week days.
Initial download of the metrics may take a while.