Fig. 16
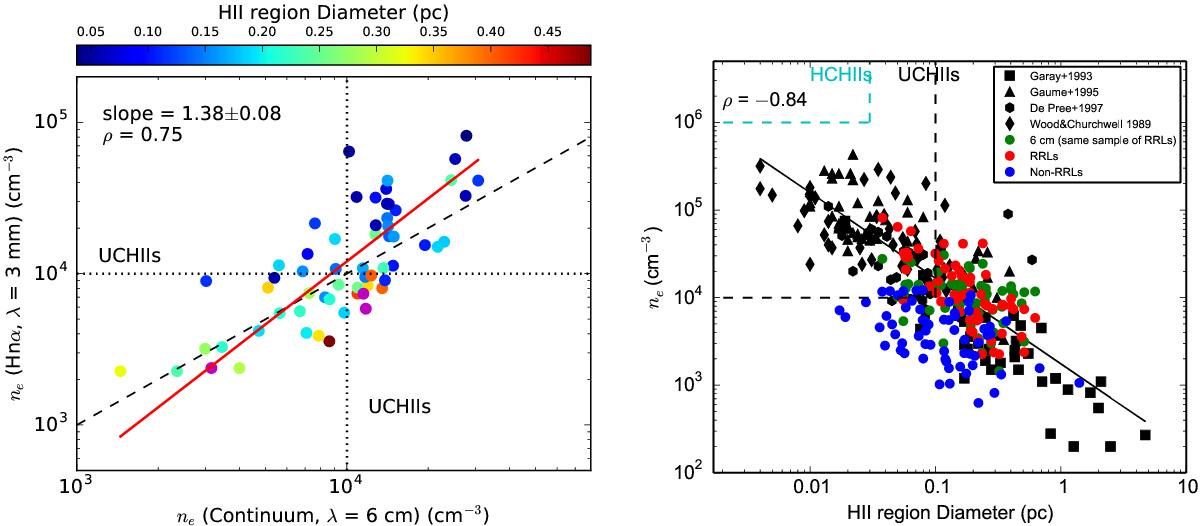
Left panel: ne derived from 6 cm radio continuum emission versus ne from mm-RRLs. Equality is indicated by the black dashed line. The dotted lines show the thresholds of electron density for UC Hii. The colors represent H ii region physical diameters in units of pc (see color bar) and the purple circles mark regions with diameter over 0.5 pc. The red line represents the best-fit line determined by an xy-bisector fit to the data. Right panel: ne as a function of H ii region diameter. The red and green symbols show the distribution of the same sample of mm-RRL detections but where the election densities are derived from the mm-RRL emission and 6 cm radio continuum emission, respectively. The black symbols indicate data from previous radio continuum surveys and the blue circles are radio sources toward which no mm-RRL emission is detected and where the electron density has been estimated from the of 6 cm radio continuum emission. The black solid line represents the best-fit line determined by a least-squares polynomial fit with one degree to the data of the previous radio continuum surveys (black symbols) and this mm-RRL surveys (red symbols).
Current usage metrics show cumulative count of Article Views (full-text article views including HTML views, PDF and ePub downloads, according to the available data) and Abstracts Views on Vision4Press platform.
Data correspond to usage on the plateform after 2015. The current usage metrics is available 48-96 hours after online publication and is updated daily on week days.
Initial download of the metrics may take a while.