Fig. 13
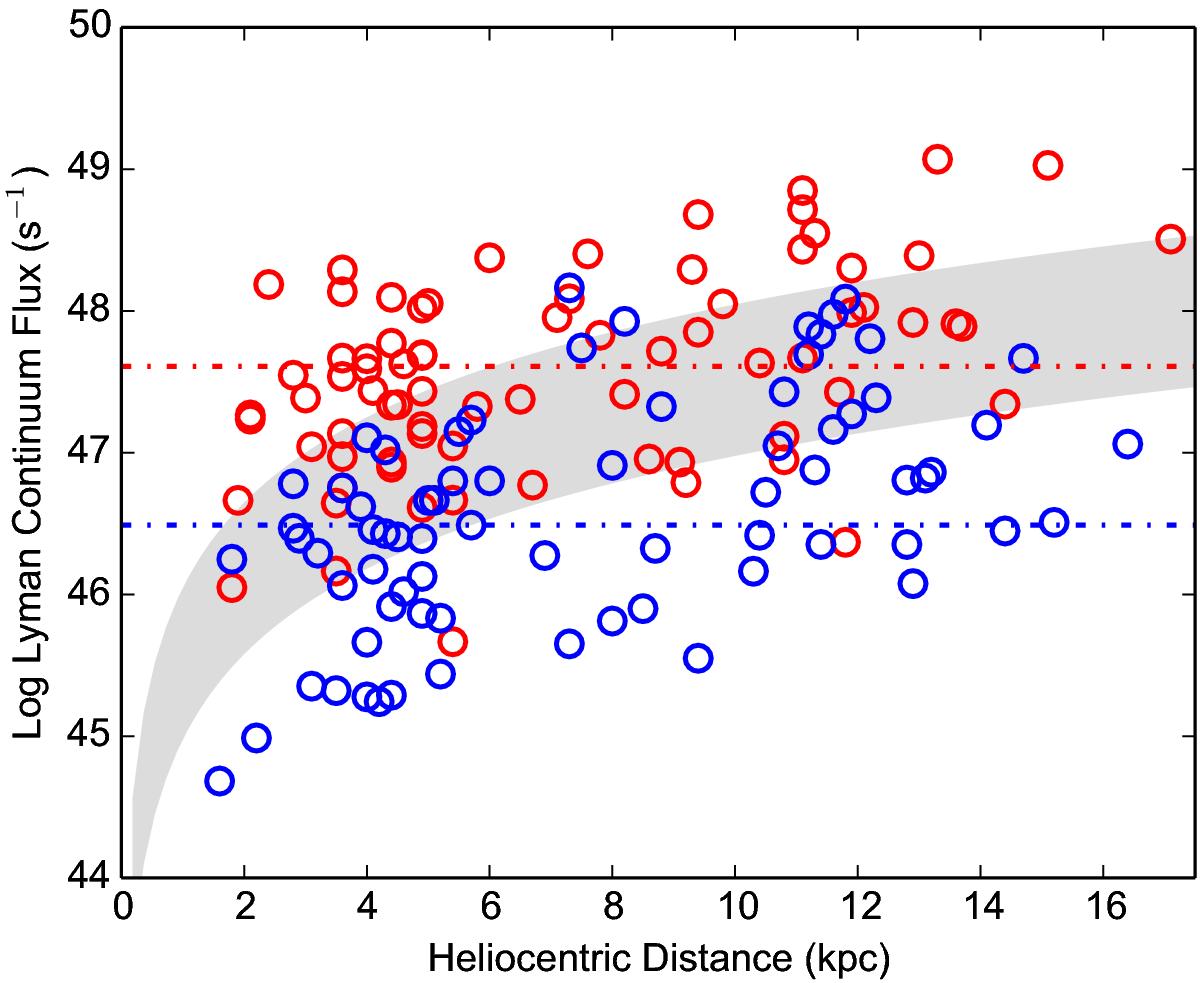
Lyman continuum flux as a function of heliocentric distance. The red and blue circles represent 6 cm radio continuum sources associated with and without mm-RRL sources. The gray area is filled between Lyman continuum fluxes estimated with median 6 cm integrated fluxes of radio sources associated with and without mm-RRL. The red and blue dot-dashed lines show median values in the Lyman continuum flux distributions for those sources, respectively.
Current usage metrics show cumulative count of Article Views (full-text article views including HTML views, PDF and ePub downloads, according to the available data) and Abstracts Views on Vision4Press platform.
Data correspond to usage on the plateform after 2015. The current usage metrics is available 48-96 hours after online publication and is updated daily on week days.
Initial download of the metrics may take a while.